


US Capital Account and International Finance
US economy has it all: modern productive services, science, and technology, capacity to mobilise the savings of the world to finance its investment, and a reserve currency and safe haven capital asset

In the 2025 Economic Report of the President the US Council of Economic Advisers included a chapter on the US economy's capital account. This chapter complements analyses of the trade and current accounts of the balance of payments published in previous Economic Reports of the President. Economists working for the Biden administration conveniently pulled a lot of data from the Federal Reserve Board, the Bureau of Economic Analysis, the Bank for International Settlements and drew on an extensive contemporary economic literature to marshal a cogent account of the US balance of payments current account and the capital account that finances it.
The focus of these analyses is on the US economy, yet given the dominance of the American economy in terms of international output at market prices and the role of the dollar in payments systems and America’s capital markets in the deployment of savings and investment, the work also provides an overview of the international economy at the end of the first quarter of the 21 century.
This article focuses on the capital account, the transactions that fund trade and current accounts and show how savings are deployed as investments. In the main this article allows the Biden administration’s economists to speak for themselves in extensive gobbets taken from chapter 6 of the Economic Report of the President - America's Role in International Capital Flows. These gobbets provide a lucid snapshot of the international capital markets as the world economy proceeds through its third decade after the millennium year in 2000.
The analysis presented in the report captures the position, fifty years after President Nixon closed the gold window and the fixed parity regime of the post-war Bretton Woods system ended. It is a world where foreign exchange markets trade the main internationally convertible currencies which float freely. Central banks are independent in their operations and give priority to domestic financial and price stability.
While the Bretton Woods regime of exchange rates trading in agreed parities against the dollar may have ended, there remains a high degree of policy coordination. The Bretton Woods exchange regime may have gone but the Bretton Wood institutions, the IMF and the World Bank go on. While trade has been freed through liberalization overseen by the World Trade Organisation. Trade and international financial transactions take place in a context of multilateral rules, supported by extensive lines of credit from their Federal Reserve acting on behalf of the US Treasury Department to the principal central banks around the world, such as the ECB, the Bank of Japan and the Bank of England.
The United States has run a steady financial account surplus throughout the 21st century. This finances its current account deficits. It is an international economy where China has emerged, that increasingly choses to support domestic demand and in practice choose partially to retreat from being dependent on international production.
Over seventy years of international economic growth has created rich economies in North America, Europe and Asia with accumulations of capital and liquidity that match their real economies. International transactions are now dominated by capital rather than current accounts. Trade in services is increasingly profitable and important relative to trade in goods. Flexible exchange rates enable current accounts to adjust to differences in demand and domestic inflation, and open capital accounts enable balance of payments deficits to be financed. In an international economy with plenty of liquidity, the balance of payments is not the sort of constraint that it was for economies, such as the UK in the 1950s and 1960s.
It is a world where long standing excess savings have been deployed across international capital markets, mainly in the American economy. The American economy has been both the world’s consumer and investor of last resort for more than two decades.
Advanced economies have experienced a long period of slowing trend growth in productivity and GDP over several decades. This has affected all advanced economies, but among them the US economy has fared noticeably better than others. It has developed new technologies and with them new products and services. The result is that the best investment returns for investors have been available in the USA. America’s scientific progress, technical innovation and capacity to adjust to economic change, have resulted in relatively high returns on capital investment in the USA. While the dollar’s reserve currency status, the liquidity of its capital markets and safe haven status of the US Treasury’s bond market have enabled the US to consume and invest without saving in the way that other economies would find difficult.
This article drawing on the Economic Report of the President published in 2025 provides a gloss or a benchmark on the international position of the US economy as it appeared ahead of the Trump Administration. It offers a sort of benchmark that President Trump’s bilateral trade policy based around reciprocal tariffs, expectations of a current account balancing and using tariffs as a significant source of domestic revenue receipts for the Federal Government could be set against. These trade policies represent a radical change of direction for US trade policy. The analysis here captures where international relations were before the step change in trade policy announced by President Trump in April 2025.
The US Capital Account has been in surplus financing the current account
Between 2000 and 2023, the financial account balance averaged $530 billion foreign financial flows lower the cost of capital in recipient economies, which can spur real investment and growth
Open Capital Accounts give economies access to international savings
Capital inflows have the potential to expand a country’s productive capacity by increasing domestic investment, while closed economies have access only to the domestic savings pool. Therefore, when net capital inflows are positive (i.e., inflows exceed outflows), domestic investment can exceed domestic savings.
Foreign Direct Investment, Portfolio Investment and International Credit are all important
Flows other than portfolio equity and debt, such as cross border lending and FDI, can play similar roles. In many instances, FDI can provide access to improved technologies leading to productivity improvements as well as knowledge transfers to the host country, access to international credit allows countries to smooth consumption over time, lending in good times and borrowing when faced with adverse shocks.
International lending and capital flows smooth the effects of the economic cycle and economic shocks
International borrowing and lending can therefore insulate countries from the fate of lurching from feast to famine. Similarly, when there is a foreign appetite for purchasing a country’s government bonds, international capital flows allow governments to finance their budget deficits at lower interest rates than would otherwise prevail.seeking U.S. assets, the geographies from which the investors come, and the types of instruments (stocks, bonds, or direct investment) that draw their attention across sectors and over time.
International finance in the 19th century paid for much of the American capital stock
International capital flows have long played an important role in U.S. economic development. Capital inflows into the United States in the form of bonds and bank loans during much of the 19th century helped finance several key industries, most notably the railway sector.
The US emerged as the world’s banker with the dollar as the world’s reserve currency
Following World War I, the United States became a lender for the first time in U.S. history, but U.S. foreign investment levelled off during and after the Great Depression.
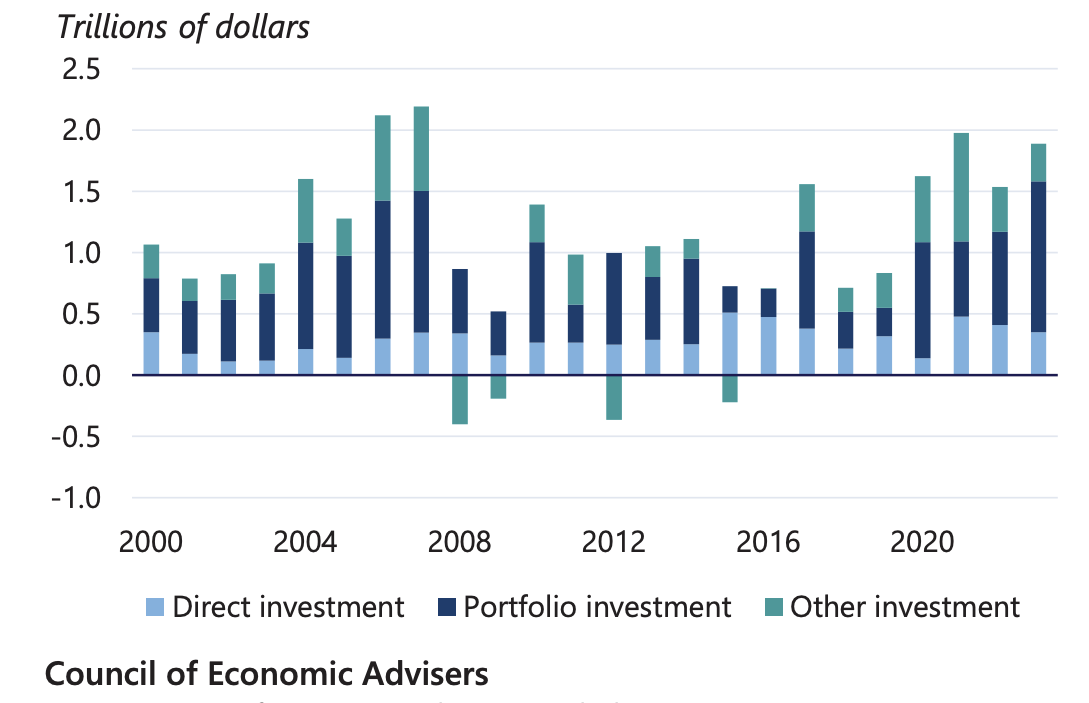
After World War II, the post-war Bretton Woods system secured dollar dominance on the international stage (Siripurapu and Berman 2023). By the mid-1970s, however, U.S. net capital flows started to reverse as the economic situation in the United States resulted in trade deficits where once there had been trade surpluses. Except in 1991, the United States has run a trade deficit since 1982. In the 21st century, capital inflows into the United States rapidly increased, peaking at more than $2 trillion on the eve of the global financial crisis in 2007.
There has been an increase in foreign investment into the United States since 2020, reflecting the strength of the U.S. post-pandemic recovery. The growth was spurred in large part by a 30 percent increase in portfolio investment in lucrative U.S. equity and debt markets. Portfolio inflows increased to $1.23 trillion in 2023 during the Biden-Harris Administration, the highest annual amount on record.
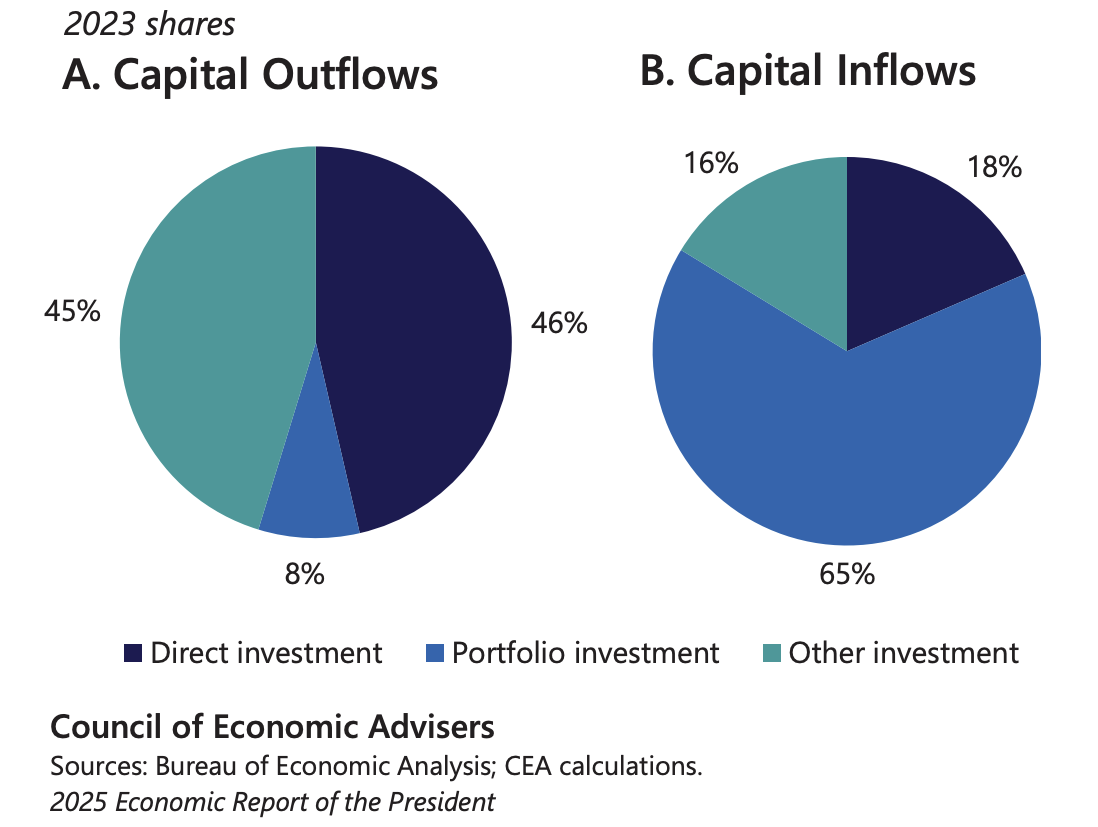
U.S. Capital Inflows
A snapshot of the composition of U.S. capital flows in 2023.
The composition of the $979 billion in capital outflows was nearly evenly split between FDI outflows and other investment outflows, with a small fraction in portfolio outflows.
U.S. Capital Outflows
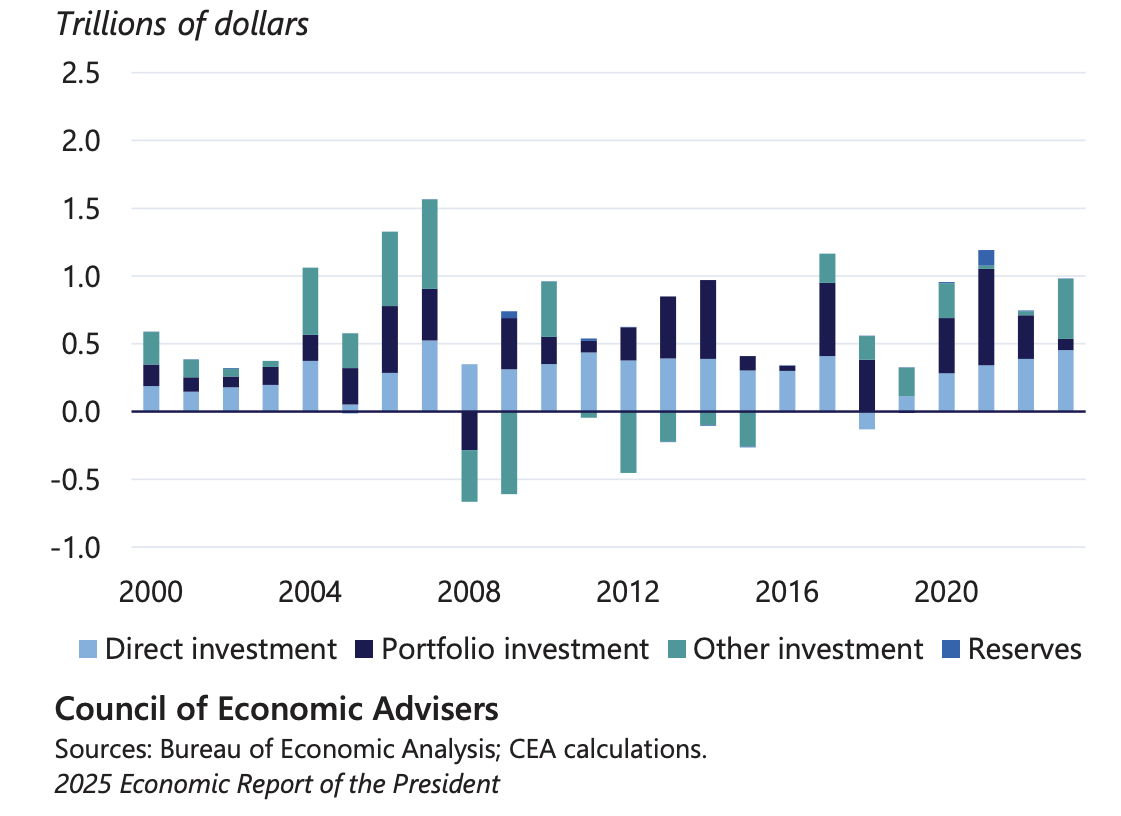
Nearly two thirds of the $1.9 trillion in inflows were in the form of portfolio debt and equity, with FDI and other investments that include cross-border lending by foreign global banks making up the rest of the balance.
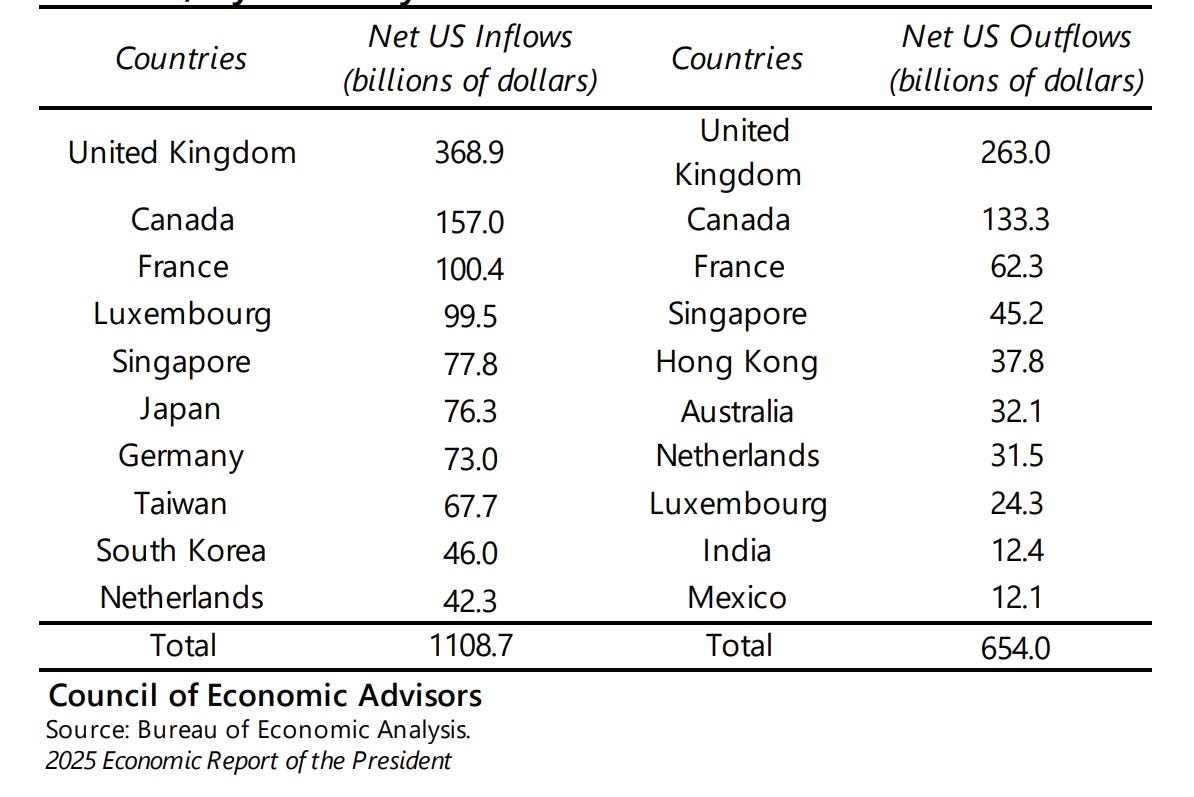
Most of the top contributors to U.S. capital flows are also top trading partners and geopolitical allies of the United States. In 2023, the United Kingdom was the top contributor to U.S. inflows, followed by Canada and France
Offshore financial centers like Luxembourg and Singapore also feature in the set of top contributors and recipients of financial flows. Mirroring U.S. inflows, the United Kingdom was also the top recipient of U.S. outflows for three out of the four years from 2020 to 2023. The United States is a diverse investor, often allocating large amounts to different sets of countries each year.
A final piece of the international capital flows picture is the international investment position (IIP), which records the stock of a country’s international assets and liabilities accumulated over time
Current account surpluses or deficits (flows) accumulate into the stocks of foreign assets and liabilities. The difference between foreign assets and foreign liabilities is the U.S. net international investment position
The US economy’s stock of international assets and liabilities
The U.S. net IIP stood at negative $21.3 trillion at the end of the first quarter of 2024, representing the difference between the stock of foreign assets ($36.0 trillion) and foreign liabilities ($57.1 trillion), the U.S. stock of foreign assets more than doubled from its value of $16.4 trillion in 2006, and the stock of foreign liabilities nearly tripled from $18.2 trillion over the same period.
Valuation effects through changes in the prices of assets and liabilities and exchange rate fluctuations impact the outstanding stocks. For example, the rise in U.S. stock prices in 2023 exceeded the rise in foreign stock prices, increasing the market value of U.S. foreign liabilities relative to U.S. foreign assets. Valuation effects have played an important role in the change in the U.S. net international investment position over the past decade
Examining the purchases and flows of assets across borders provides insight into how investors view the international economic and financial landscape. The purchase of foreign equities or debt appears in a country’s financial account under the category of portfolio investment. While foreign investors have long viewed American debt as safe investments, they increasingly see U.S. equity markets as attractive investment destinations due to their persistent dynamism and growth on a scale often surpassing that of other countries. Relative to those of the nation’s trading partners, American companies continue to offer highly productive and, as a result, highly lucrative investment opportunities. Thus, the United States is increasingly the world’s brokerage
The high and rising demand for taking part in the U.S. financial ecosystem is reflected in the rapid rise in U.S. foreign liabilities (i.e., domestic financial assets owned by foreign investors). Total U.S. international portfolio liabilities more than tripled between 2006 and 2024. The increase represents both changes in asset valuation and purchase volume.
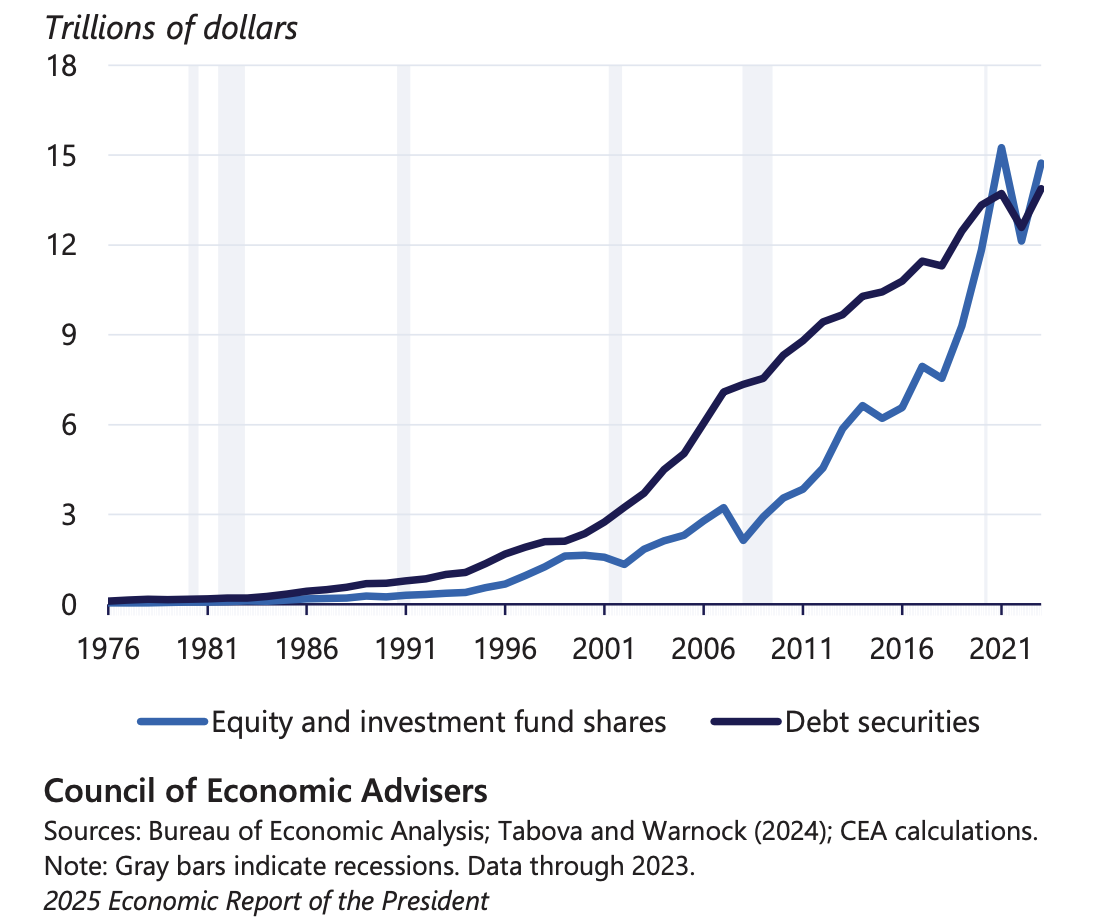
The shift from debt to equity liabilities
Although the increase in portfolio liabilities occurred in both debt and equity investments, the composition of U.S. liabilities has shifted from debt to equities. Two decades ago, most foreign investors bought more U.S. debt than equities. In the last several years, U.S. equities have become more popular, with current total equity liabilities exceeding total debt liabilities, reflecting a steady increase in purchases from abroad as well as valuation effects. Previously, foreign investors earned mostly low yields from American debt while U.S. investors received high returns from foreign equity and debt investments.
Foreign Investment in U.S. Equities and Debt
Strong returns on capital invested in the US reflecting productivity growth based around technology and innovation
The consistent demand for U.S. assets can be attributed to the relatively strong returns earned by foreign investors in U.S. markets. The consistent demand for U.S. assets can be attributed to the relatively strong returns earned by foreign investors in U.S. markets. Figure 6-8 provides the average annual returns earned on investments by foreigners from 2003 to 2023 (denoted by liabilities on domestic assets) as well as the returns earned by Americans investing abroad (denoted by claims on foreign assets).
During the period, foreign investors averaged 8.7 percent yearly returns on U.S. equities and 2.8 percent yearly returns on U.S. debt. Although portfolio values may fluctuate from year to year, the averages show investors have been rewarded for placing their money in U.S. financial assets. Across both asset classes, total returns for foreign investors were 5.4 percent over the decade. Foreign investor returns in dollar terms reflect the rise in the stock prices and the rising dollar since 2012.
Average Annual Investor Returns on U.S. and Foreign Portfolio Investments, 2003–2023
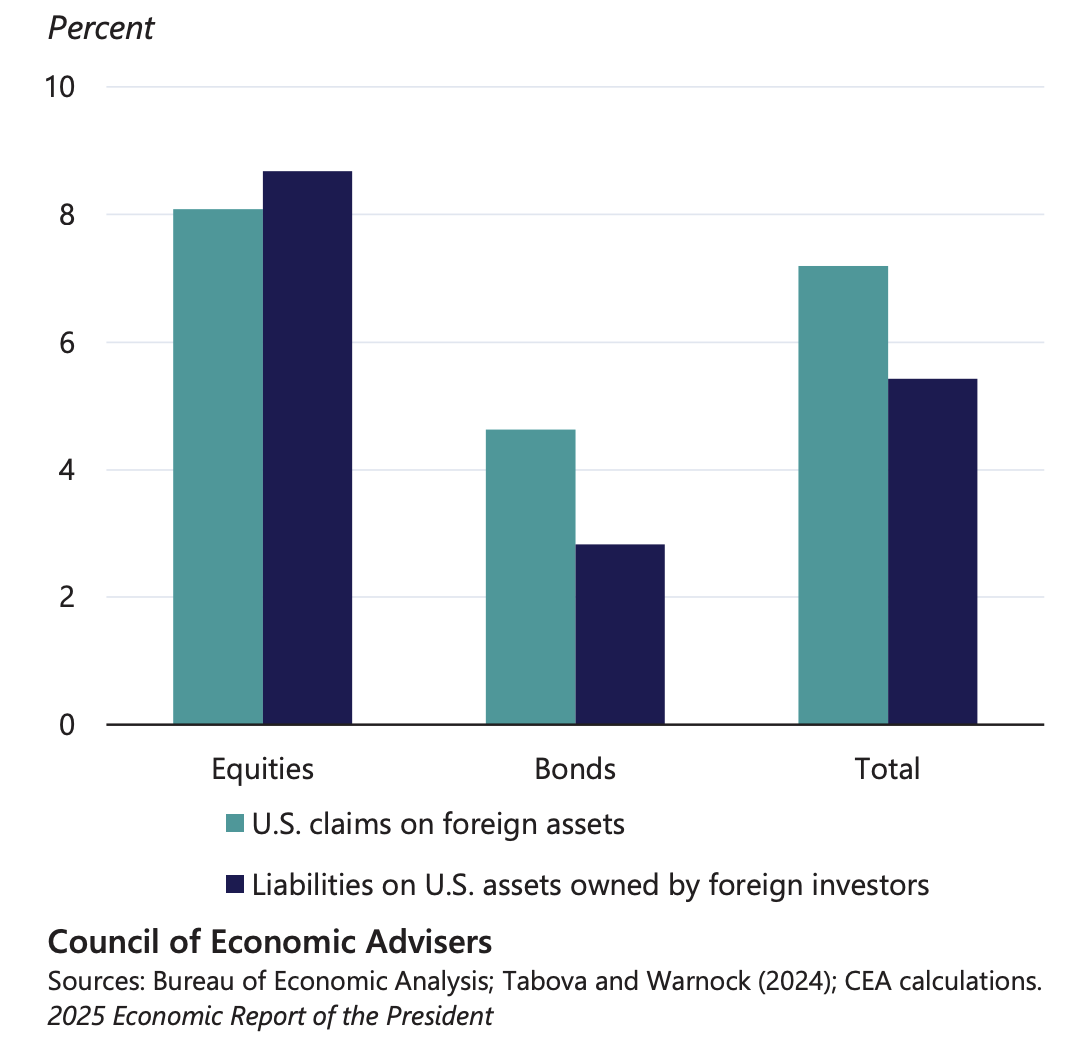
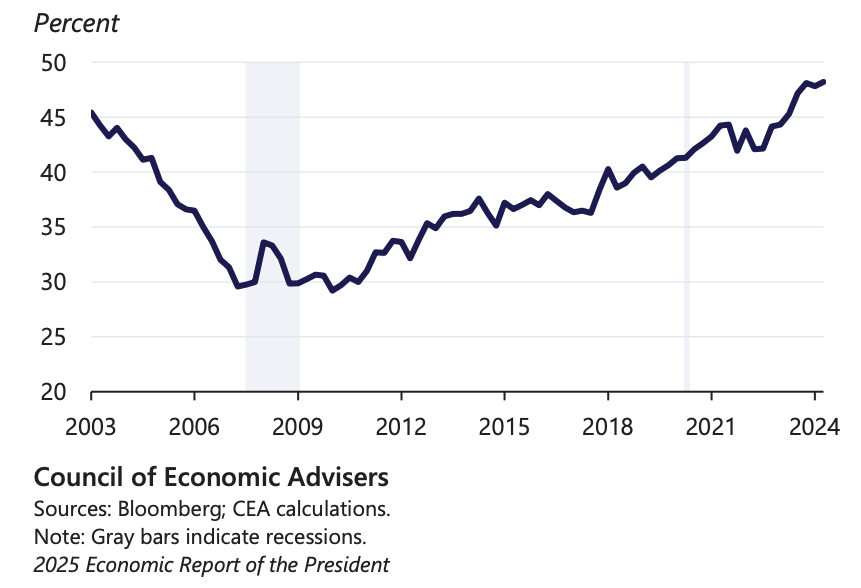
The equity returns earned by foreign investors in U.S. equity markets were slightly higher, about 0.6 percentage points more on an annual basis, than the returns earned by U.S. investors in equity markets abroad, over the past two decades. The differential can be attributed to the faster growth U.S. equity markets have experienced over the last decade, which can be seen by comparing U.S. market capitalization to total world market capitalization
The high returns earned by foreign investors on U.S. financial assets have been accompanied by American investors seeing large returns on their investments abroad. U.S. investors averaged 8.1 percent yearly returns on foreign equities and 4.6 percent yearly returns on foreign debt from 2003 to 2023. Indeed, when considering both debt and equities, American investors’ returns abroad were higher on average than their foreign counterparts’ returns on U.S. investments. The difference was historically due largely to higher yields on foreign debt compared to U.S. debt The low yields on domestic debt can be attributed to continued high demand for U.S. debt offerings, due to their safety and liquidity in the eyes of investors in the United States and around the world as well as steady Federal Reserve policy. .
U.S. Market Cap as a Share of World Market Cap
The United States has historically been the largest recipient of FDI inflows. The increase is consistent with both the strength of investment opportunities in the U.S. economic recovery.The United States also invests in foreign companies around the world. The investments return earnings to American stakeholders while improving economic cooperation and knowledge transfers across partner countries. Indeed, primary income receipts—which include interest, dividends, and profits earned for American investors abroad—increased by nearly $200 billion in 2023.
FDI fosters development in host countries. The resulting efficiency gains help stimulate economic growth and spur job creation. Another key FDI benefit is knowledge spillover gained by sharing expertise and know-how across borders, including the introduction of advanced technologies. Finally, FDI flows are crucial drivers of international economic integration and help establish supply chains with strategic partners across borders, also known as global value chains
High American Internal Rates of Return on capital
A final metric tells the same story of the high returns American markets offer. Internal rates of return (IRR) are defined as the interest rates required to set the net present value of an investment equal to zero. A high IRR indicates an elevated return, as the payoff from the investment must be discounted at a higher rate to reduce it to zero in net present value terms. Similar to the annual returns above, from 2003 to 2022 foreign investors had an IRR on their investments in the United States of 8.7 percent, slightly higher than the 7.9 percent that American investors had abroad.
Foreign Direct Investment into and out of the United States
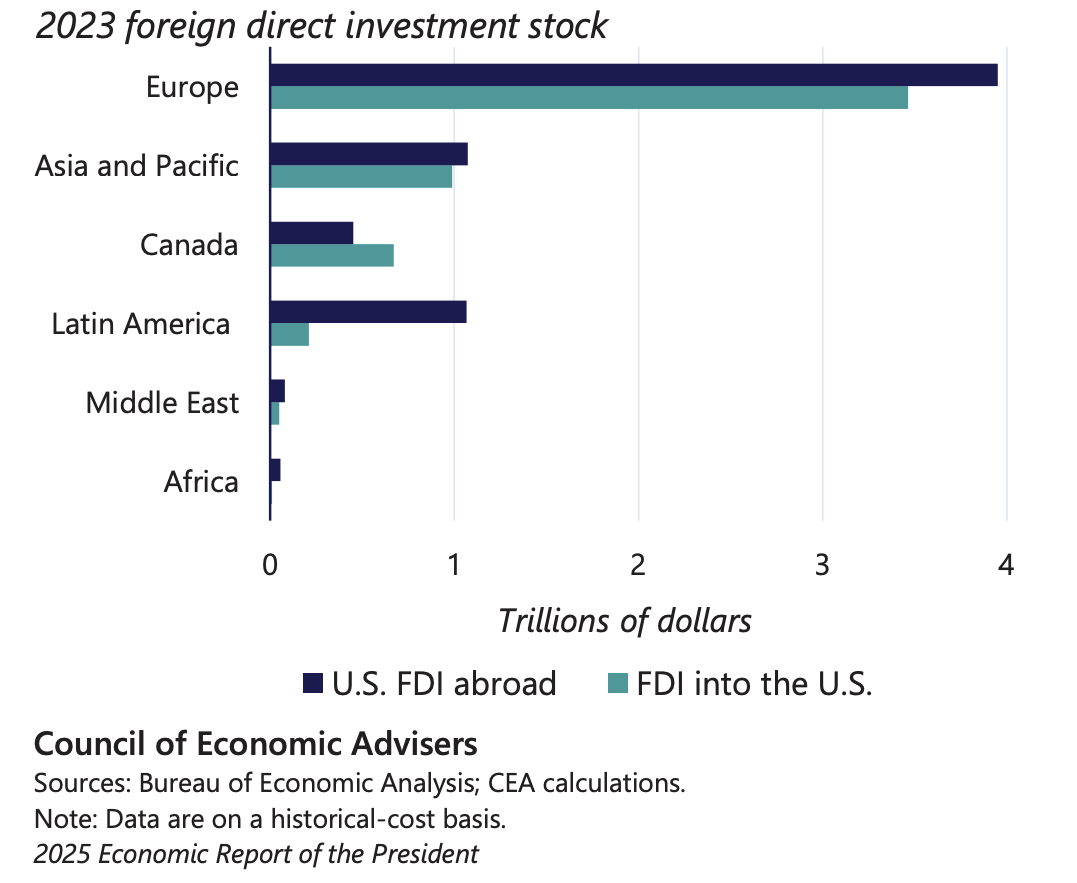
In 2023, the stock of FDI by U.S. firms worldwide totaled $6.7 trillion. During 2023, new FDI abroad totaled $364 billion. The United States benefits from outward FDI into other countries by acquiring market share abroad, strengthening supply chains, accessing know-how abroad, and bringing earnings back home.
U.S.-based multinational companies earned $577 billion in income from investments abroad in 2023, much of which makes its way back to American stakeholders (BEA 2024f). Other countries benefit from the investments, and American technical expertise and capital more than 50 countries received at least $1 billion in new investment from the United States in FDI in 2023. The United Kingdom ($1.1 trillion), the Netherlands ($980 billion), and Luxembourg ($532 billion) were the top three recipients, measured by total stock of U.S. FDI. In terms of outward direct investment, America engages overwhelmingly with strategic partners. At the same time, inbound investments from China and outbound investments have ticked downward. The Chinese footprint in the United States measured via the stock of accumulated direct investments declined by 23 percent from 2017 to 2023.
International flows of credit and lending
The cross-border lending market is another important aspect of global financial integration. Grouped in the category of “other flows” in the financial The cross-border lending market is another important aspect of global financial integration. Grouped in the category of “other flows” in the financial.
Making up an increasingly large share of total lending, cross-border lending plays a critical and growing role for the United States. Specifically, lending by foreign banks to firms in the United States serves a critical diversification function for banks around the world, and this lending also helps to stabilize the domestic banking system by accessing foreign bank balance sheets via internal capital markets.
Lending to the United States, by Sector
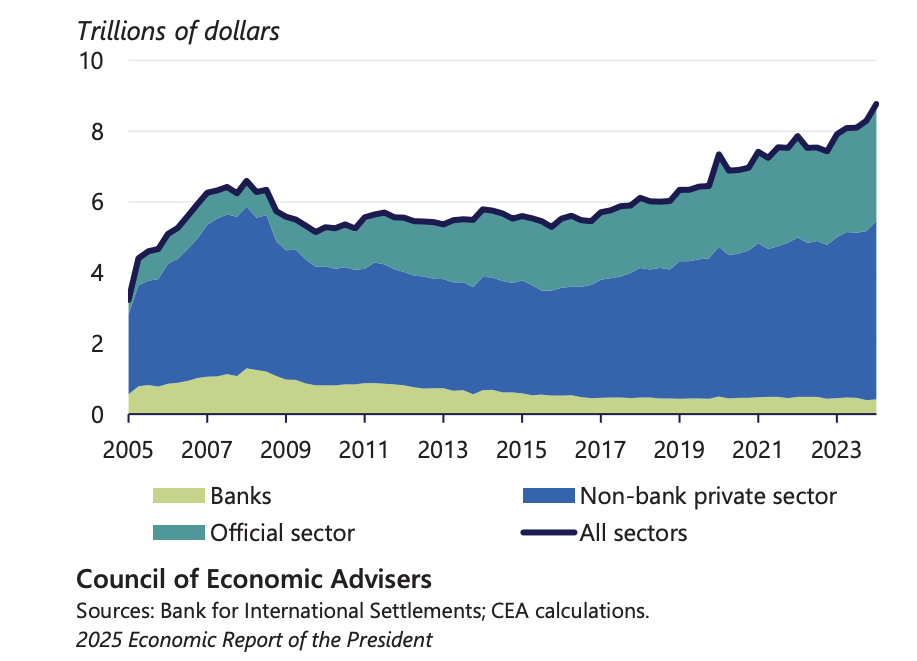
The stock of U.S. cross-border lending assets increased from $3.2 trillion in the fourth quarter of 2019 to $3.8 trillion in the second quarter of 2024. The stock of U.S. cross-border lending liabilities increased from $3.5 trillion to $4.8 trillion over the same time period, according to the Bank for International Settlements’ locational banking statistics.
Foreign lending represents a large share of credit provision in the United States. As of September 2024, foreign banks accounted for $1.1 trillion in U.S. loan provision and held $3.1 trillion in aggregate assets, approximately 13 percent of the U.S. banking system’s total assets. The total assets of branches and agencies as well as foreign subsidiaries currently total more than $4 trillion.Like other forms of investment moving to U.S. shores, the loans signal a continued faith in the profitability and creditworthiness of American businesses.
Local and Cross-border Lending Claims
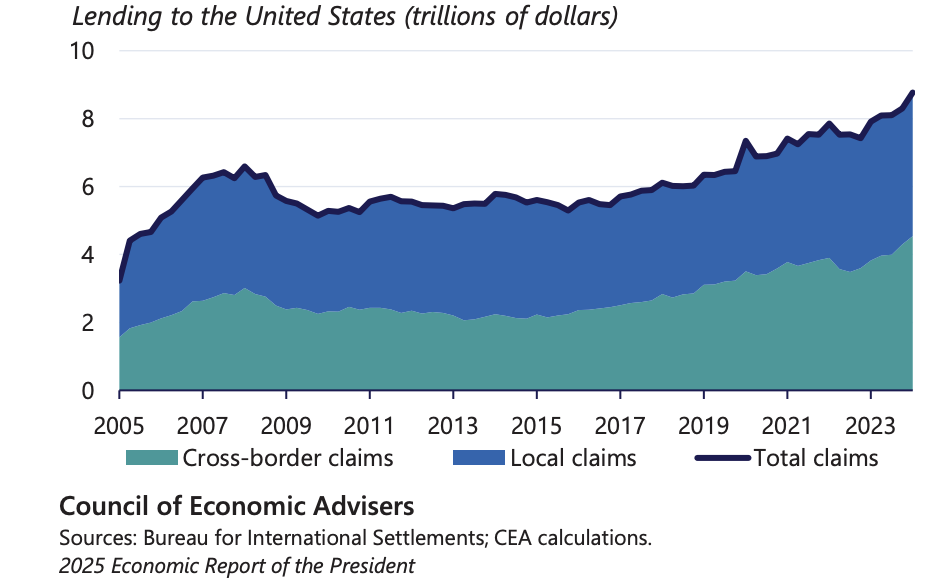
As with FDI, cross-border lending funds primarily originate from U.S.-allied countries, strengthening financial ties with strategic partners (see figure 6-14). According to the Bank for International Settlements’ consolidated banking statistics, the top three countries for cross-country lending are Japan ($2.4 trillion), Canada ($2.0 trillion), and the United Kingdom ($1.4 trillion)
In the 1980s, banks primarily engaged in sovereign lending, which shifted into interbank lending activity across borders. More recently, global banks have engaged in direct lending to non-bank financial intermediaries and nonfinancial corporations.
After the credit crunch and the Great Recession between 2007 and 2010 ‘cross-border lending by banks fell significantly from a pre-crisis peak of approximately 20 percent of total claims in 2008 to 4.8 percent in 2024. In contrast, cross-border non-bank private sector (e.g., mutual funds and hedge funds) and official sector claims have increased significantly since the mid-2010s.
The US Treasury Bond Market
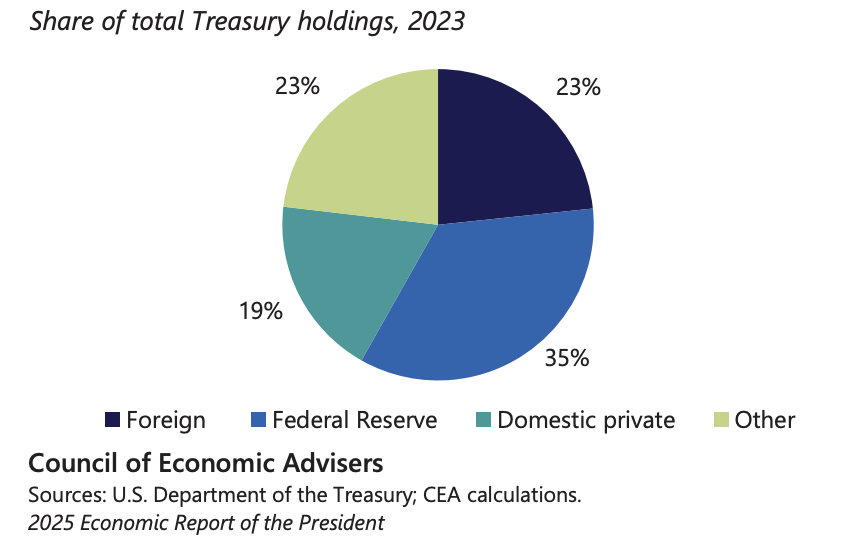
A wide range of investors hold U.S. Treasuries, displaying an international consensus in the safety of U.S. debt. The share of foreign holdings in publicly held outstanding Treasuries was approximately 14 percent in 1990 and peaked at 34 percent in 2014. In 2023, foreign official and foreign private investors accounted for nearly a quarter of U.S. Treasury holdings
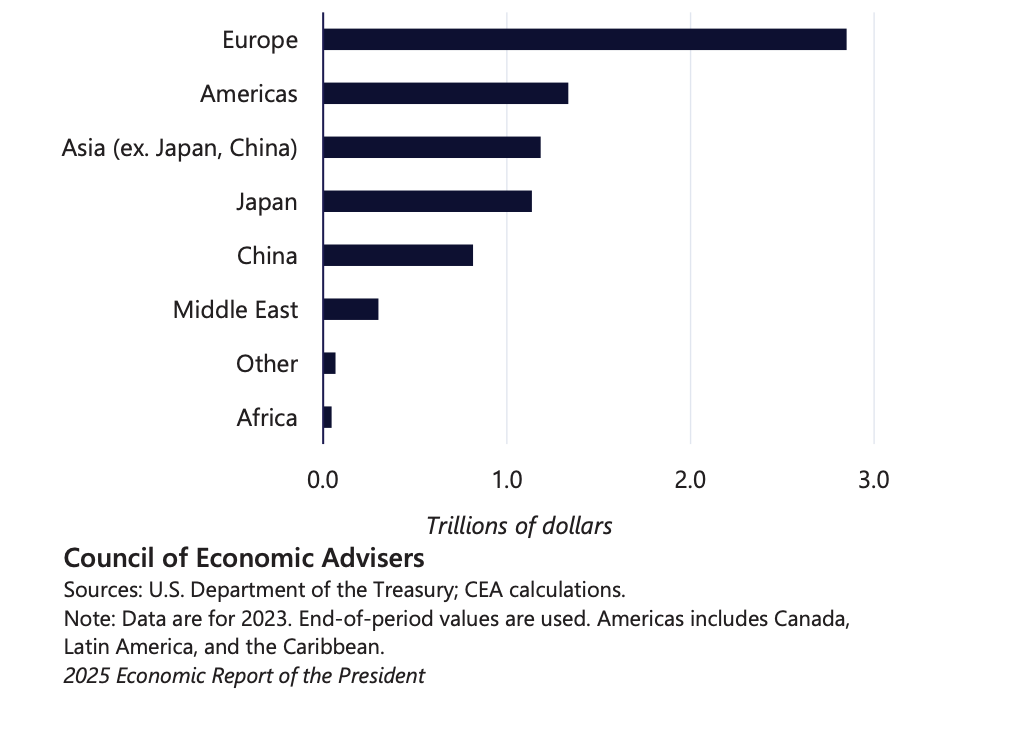
The demand for U.S. Treasuries spans the globe. Of foreign-held Treasuries, European investors accounted for more than a two-fifths share (44 percent) and investors from Asia and the Americas held approximately 25 percent each in 2023. The top three investor countries, as of August 2024, were Japan ($1.1 trillion), China ($774.6 billion), and the United Kingdom ($743.8 billion). Saudi Arabia, the United Arab Emirates, Kuwait, and several other oil producers also held significant Treasuries.
U.S. Treasury Holders, by Type
The role of the dollar and Treasury bonds in official foreign reserves
While foreign official holdings of U.S. Treasuries held steady at about $3.5 trillion over the 2013–2023 period, foreign private holdings more than doubled from approximately $1.3 trillion in 2013 to $3.0 trillion at the end of 2023. Foreign holdings suggest that reserve managers at most foreign central banks continue to view U.S. Treasuries as safe investments, which also constitute a stable source of demand.22 Foreign countries also hold dollar reserves in the event that they need to stabilize their exchange rates through interventions in currency markets. The evidence refutes arguments that the dollar is losing its dominance in the international financial system or that U.S. Treasuries are no longer desirable as safe haven investments.
Holdings of U.S. Treasuries, by Geographic Region
The rising worldwide demand for U.S. Treasuries plays a key role in reducing the cost of financing American debt (Weiss 2022). Researchers have estimated the magnitude of foreign official purchases of U.S. government securities on Treasury yields
The increase in demand for U.S. Treasuries was large enough during the crisis that Treasury prices rose despite a massive simultaneous supply increase. Bond purchases by the Federal Reserve during the period of quantitative and monetary policy easing also served to lower yields (Krishnamurthy and Vissing-Jorgensen 2011). In other words, the surge in demand for Treasuries exceeded the supply increase, resulting in elevated bond prices and lowered yields.n
Foreign investors also turned to U.S. debt during the period of uncertainty surrounding the COVID-19 pandemic. At the onset of the pandemic, private and official foreign investors sold U.S. Treasuries to cover precautionary liquidity needs (referred to as the “dash for cash”), but the demand for Treasuries quickly rebounded.
Absorption of US Treasury Net Issuance, by Sector
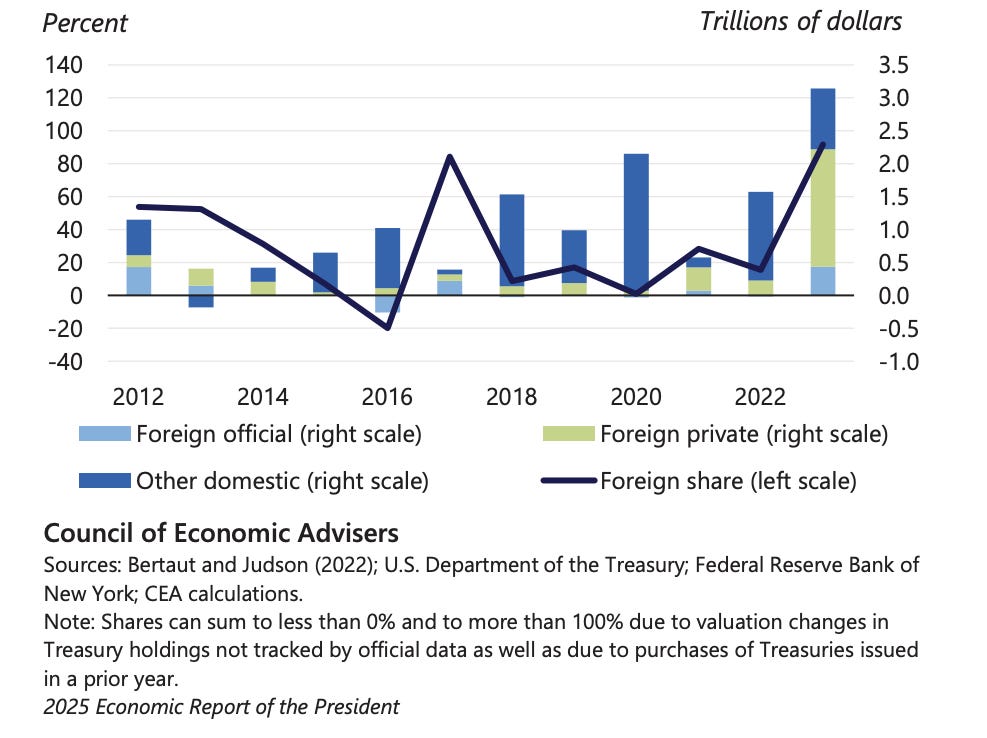
U.S. Treasury demand remained high into the post-pandemic period. Foreign private investor net purchases of Treasuries in 2023 were more than ten times their pre-pandemic (2017–2019) average
On average, foreign investors absorbed roughly 19 percent of Treasury net issuance in the five years preceding the pandemic (Weiss 2022). Over the 2021–2023 period, foreign investors absorbed an average of 45 percent annually.
The US Dollar as an international reserve currency
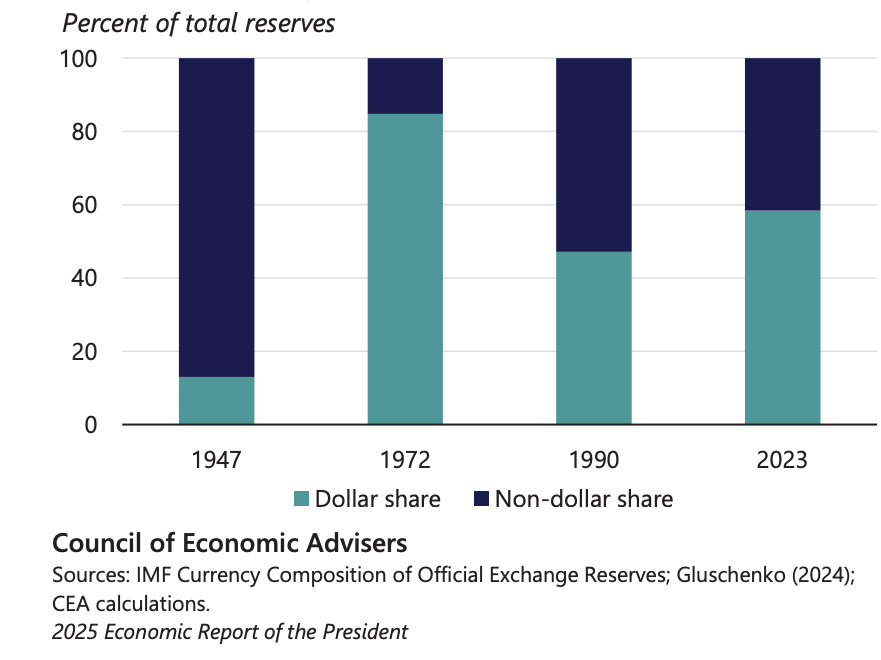
The share of the dollar in global foreign exchange reserves grew from about 13 percent in 1947 to 85 percent by 1972, when the dollar became the currency of denomination for trade in commodities like oil and world trade invoicing. Today, the foreign borrowings of many countries are predominantly in dollars, and the dollar occupies a central position in the international monetary system, playing an outsized role in facilitating international trade
Composition of Foreign Exchange Reserve Holdings
Reserve currency status confers several benefits on the United States. While the dollar plays a pivotal role as an international medium of exchange, it also functions as an important store of value. Countries use their dollar reserves to purchase dollar-backed safe assets, namely U.S. Treasuries. The dominant reserve currency status and global demand for safe assets allow the United States to issue debt at relatively low yields compared to other sovereign nations (Chen et al. 2022; Maggiori, Neiman, and Schreger 2019). The ability to borrow and pay for imports in dollars shields the United States from adverse exchange rate movements and the potential for balance of payments crises.
The extent of international payment system fragmentation also remains modest (Gopinath et al. 2024). SWIFT data show that 80 percent of trade finance transactions continue to be settled in dollars. Commodity trade also continues to be invoiced and settled predominantly in dollars and the dollar’s strength bears testimony to foreign investors moving into dollar assets
Reserve currency status allows the United States to use the dollar as a tool for international diplomacy and advancing its foreign policy objectives. While the recent use of financial sanctions has led to de-dollarization fears, the depth and liquidity of U.S. Treasury markets and robust global demand for Treasuries as a safe asset suggest that the dollar’s utility remains intact Reserve currency status allows the United States to use the dollar as a tool for international diplomacy and advancing its foreign policy objectives. While the recent use of financial sanctions has led to de-dollarization fears, the depth and liquidity of U.S. Treasury markets and robust global demand for Treasuries as a safe asset suggest that the dollar’s utility remains intact’.
Conclusion
This analysis of the international position of the US presented in January 2025 by the Biden administration’s economists provides a helpful picture of the international role of the dollar and US economy ex ante April 2025. It confirms a picture of a very large, adaptable economy that is working at the edges of innovation and the technological production frontier. An economy where services are increasingly important and where digitally provided services are increasingly important and provide sustained supernormal rates of return on capital. It is a world where balance of payments current accounts are not a constraint on economic activity and where economies with the greatest investment potential can mobilise huge amounts of capital even when their levels of investment exceed their rates of saving. Historically it was rich mature economies that channelled their savings to developing economies that had greater need for capital and provided higher rates of return on capital, albeit at higher risks. This was the story of British investment in North America in the 19th century. A striking thing about the international economy over the last thirty years has been the way that one of the world’s richest and most advanced economies has mobilised the savings of less advanced economies and provided some of the best investment returns available in the world, but with the institutional security of the rule of law, liquid capital markets and an independent and by most standards reliable central bank.
The Biden administration's economists draw attention to perceived disadvantages of increased integration of world markets in terms of disruption of manufacturing and traditional communities. This is testimony to the extraordinary international nostalgia for manufacturing and extractive industries such as coal; and they provide an eloquent explanation of the Biden administration’s green industry policy. They even, with great flair, coin the term ‘crowding in’ of manufacturing investment to describe the manner in which the Inflation Reduction Act, the CHIPS and Science Act and the Made in America initiative attracted foreign direct investment.
Yet despite this gloss of nostalgia, the true picture of the US economy is of a highly productive, increasingly science and technologically serviced based economy that is extraordinarily well placed to produce, employ and use resources including savings from around the world. The reserve currency status of the dollar and the full faith and credit of the USTreasury enable the US to use active fiscal policy as part of macro-economic stabilisation and management in a manner that economies in Europe hesitate to do. In short an unusually prosperous economy that enjoys great advantages when it comes to trade and using international financial markets.
Warwick Lightfoot
16 May 2025
Warwick Lightfoot is an economist and was Special Adviser to the Chancellor of the Exchequer between 1989 and 1992.