
Structure of the US Balance of Payments and Capital Account
Dissecting the US Current Account: Trends, Transformations, and the Path from Hyperglobalization

The economists that served President Biden’s Council of Economic Advisers in successive editions of the Economic Report of the President put together a comprehensive and useful analysis of the US economy’s external accounts against the wider context of evolution of international trade over the last thirty-five years. Cumulatively the chapters on trade in successive editions of the Economic Report provide a series of stylised propositions about international trade and US economy’s position that offer a useful starting point or benchmark when trying to understand where trade policy is moving from today. This article draws on and attempts to exemplify analysis presented in the Economic Report of the President in 2024. It concentrates on the evolution of balance of payments current accounts internationally and in the US.
After three decades when the international economy has become more integrated, the process of integration has now plateaued. In this context the ‘ United States is the world’s second-largest trading country, with more than $7 trillion in combined goods and services exports and imports in 2022, and it remains both the largest source of and destination for foreign direct investment’.
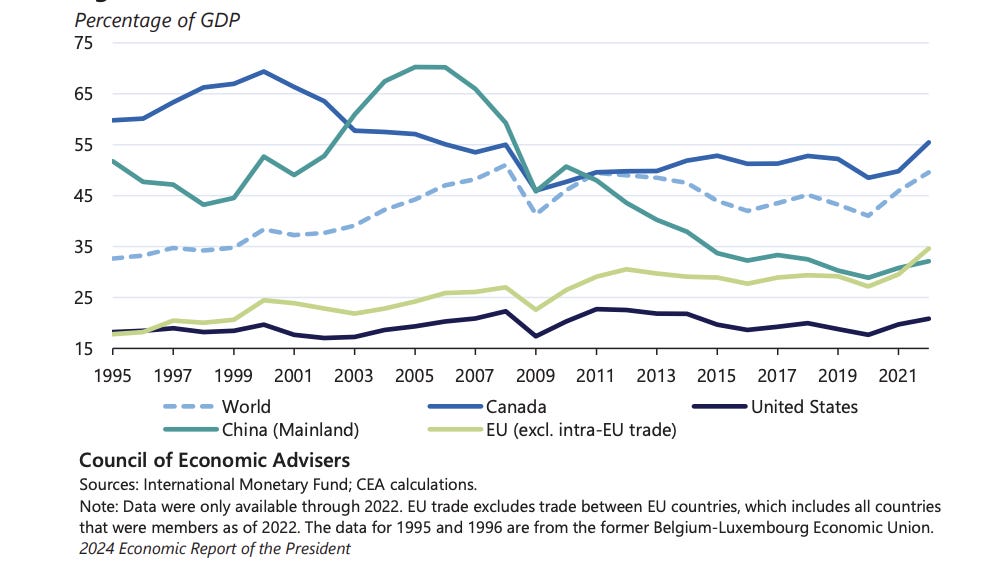
Trade in Goods as a Percent of GDP, 1995–2022
Hyperglobalization
The hallmark of modern trading conditions has been the development between 1990 and 2020 of “hyperglobalization.” This was the ‘defining economic story of the 1990s and early 2000s’.
There were ‘major liberalization episodes include the integration of former Soviet countries in the early 1990s with the rest of the global economy, the creation of the World Trade Organization in 1995, and China’s accession to the World Trade Organization in 2001’.
Slowbalization
The high water mark of this globalisation was 2007 ahead of the credit crunch, the financial crises and the great recession that followed in 2008.Global goods trade integration—the total value of goods exports and imports as a share of gross domestic product (GDP)—rose steadily, from 33 to 51 percent, between 1995 and 2008.’
Trade ‘largely stagnated after the global financial crisis and, while 2021 and 2022 saw a rebound, global goods trade integration remained below its 2008 peak and may level off once again as goods consumption normalizes in the aftermath of the COVID-19 pandemic.’ Council of Economic Advisers credits the Economist newspaper with coining the term “slowbalization” in 2021.
While trade in goods slowed, trade in services became more intense probably reflecting the increasing importance of services in advanced economies. The Biden administration’s economists drew attention to ‘a notable exception—trade in commercial services excluding travel and transportation (e.g., business services and telecommunications) grew much faster than goods between 1990 to 2023 and shows no sign of slowing.’
Newbalization
This continuing rise in cross-border digital activity has been associated with the idea of “newbalization,” indicating the changing nature of globalization with a slowdown in flows of tangible goods while intangible flows (e.g., of digital services and cross-border data) accelerate.
The main source of the decline in the trade intensity of goods resulted from changes in Chinese trade. ‘China’s decline in goods trade integration since 2006—an outsized 38-percentage point drop—is the primary driver for the observed slowing in global goods trade integration, and reflects the country’s shift away from importing intermediate inputs and in favor of domestic sources for its production’
The economics literature describes the share of trade relative to GDP as trade openness. The United States’ trend line of overall goods trade integration differs from the other economies in two respects. First, during the steady increase of goods trade integration in the 1990s and early 2000s, U.S. trade integration remained well below the world average and that of most other major economies. Second, the United States’ decline in goods trade integration since the global financial crisis has been far smaller than China’s decline’.
Cynical factors - dramatic losses of demand that resulted from the financial crisis
There are both cyclical influences and structural factors shaping the evolution of trade. ‘Cyclical factors include sluggish recoveries since the global financial crisis in advanced economies that have weighed on global aggregate demand, and the impact of the crisis on the financial and corporate sectors, which were compelled to address vulnerabilities in their balance sheets by deleveraging and rebuilding capital buffers’. The US had a much stronger recovery after 2009 than other economies. This reflected both a more ambitious fiscal stimulus between 2008 and 2010 and looser fiscal conditions than other advanced economies in the decade that followed and much more ambitious use of fiscal policy by the Trump and Biden administration during the covid crisis.
And ‘just as some economies reached their pre-2008 unemployment levels roughly a decade later, a new set of cyclical shocks surfaced—including the COVID19 pandemic and Russia’s further invasion of Ukraine—each of which had an adverse impact on global financial conditions and complicated trade flows’.
Structural influences arising from changes in the nature of international specialisation
Secular factors include a slowdown in production fragmentation, or the unbundling of tasks across borders, also known as global value chains (GVCs). Other secular factors include China’s slowdown in growth and decline in share of trade relative to GDP; in the 21st century, China’s annual GDP growth rate reached a high in 2007, roughly coinciding with a peak in the country’s trade integration, and has since been persistently lower. Ongoing geopolitical tensions and rising national security concerns have also resulted in an increase in trade sanctions, with the highest share of global trade affected by sanctions since at least 1950.’
Both the ‘United States’ and European Union’s shares of content in other countries’ domestic final demand dropped across 2009 and 2019; in contrast, China’s content in these countries’ domestic final demand increased.
For example, the share of U.S. value added in Mexico’s domestic final demand fell by 4 percentage points between 2009 and 2019, and in contrast, China’s share increased by 7 percentage points. And while the share of U.S. value added in India’s domestic final demand increased by 1 percentage point between 2009 and 2019, China’s share of value added increased by 6 percentage points over the same period.
Indicators of Global Value Chain Participation
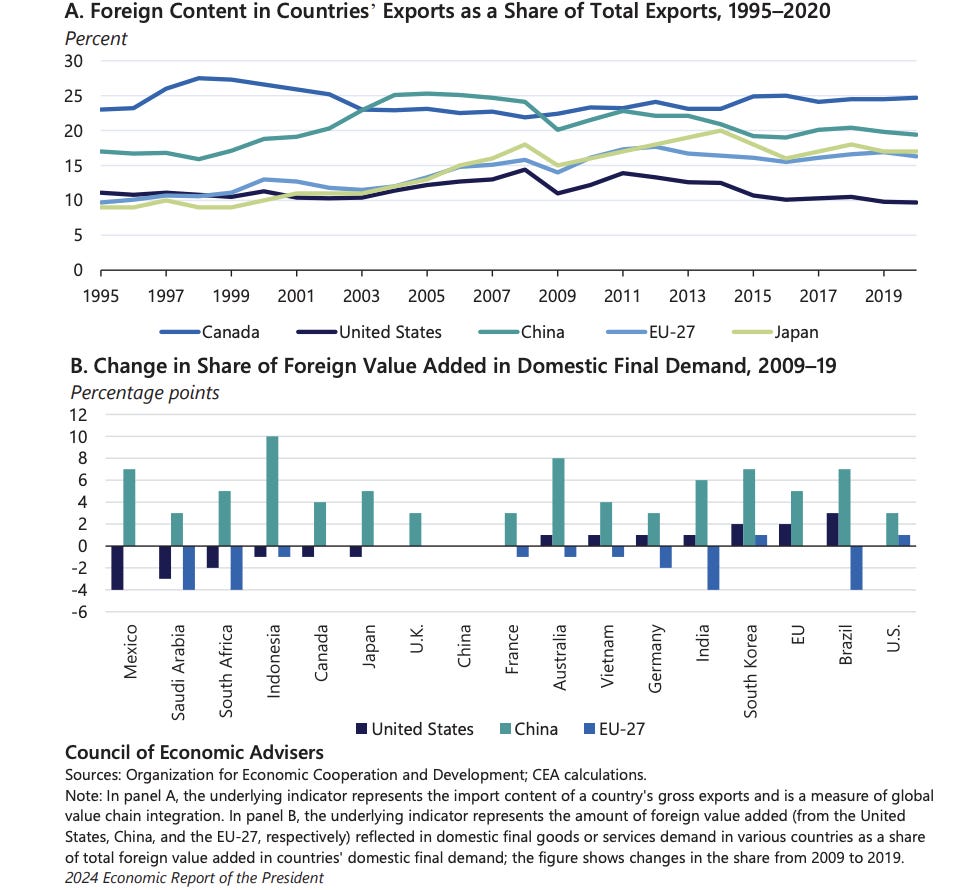
The shares of U.S. and European Union value added in China’s domestic final demand remained unchanged over this period. Putting the two sets of findings together suggests that U.S. exports had a lower value share of foreign-produced components in 2019 compared with 2009, while other countries became more dependent on China as a source of inputs in their domestic consumption. Lower cross-border connectedness may risk reducing the gains from trade and Foreign Direct Investment.(FDI) for the U.S. economy.
The share of foreign value added in countries’ domestic final demand reflects how much value added in goods and services purchased in other countries’ domestic markets originates from abroad and shows a “domestic economy’s relative connectedness to production in other countries and regions—independent of whether or not there are direct imports from foreign (upstream) industries” (OECD 2021). Indicators of forward global value chains (GVC) participation that measure domestic value added sent to other countries as a share of overall exports paint a more sanguine picture but do not offset the multitude of indicators pointing to a generalized slowdown in GVC participation’.
Increasing role of services in trade
‘Services exports exhibited positive growth throughout 2023 and, on a monthly basis, reached a historic high in November 2023. Services export sectors—including the financial sector, telecommunications, computer and information services, and intellectual property (e.g., patent and trademark licensing), and other business services (including services related to research and development, computer and data processing, engineering, and services that cover management of construction projects)—were largely unaffected by the pandemic. This is important because these collectively represent high-value-added activities in which the United States continues to maintain a comparative advantage.
Within services, telecommunications, computer and information services, and other business services have grown steadily and were especially resilient during the three recessions between 1999 and 2023. Two factors explain this resiliency. First, services trade is often governed by long-term contracts that are not easily changed without long lag times. Second, services trade represents an extreme form of highly agile, “just in time” production: inventories do not present obstacles in the event of a shock, and resources can be redirected quickly toward other goals’.
The US economy’s comparative advantage is in services not manufactured goods.
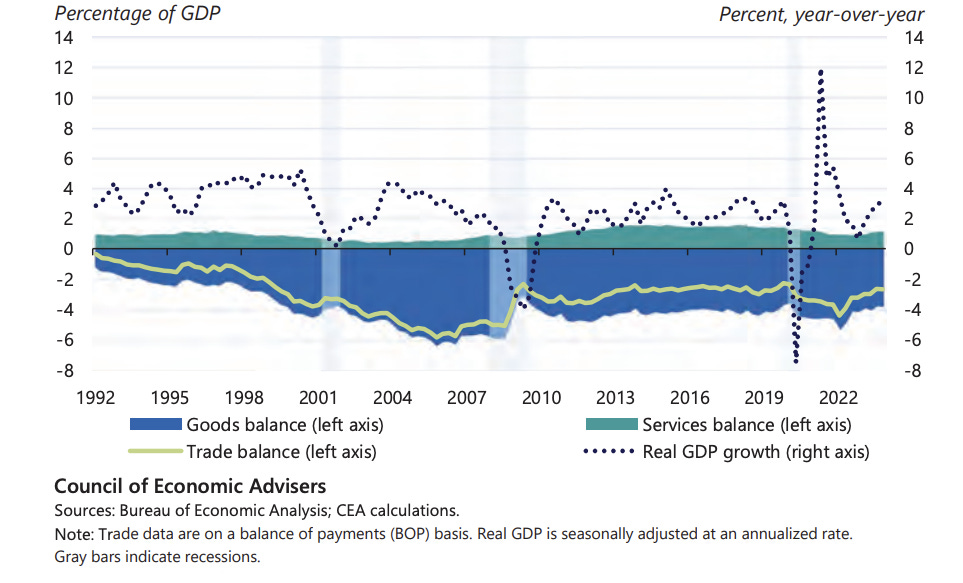
The Biden administration’s economists point out that the ‘United States is a net exporter of services and a net importer of goods. Because the magnitude of its goods deficit far outweighs that of its services surplus, overall, the United States has run a trade deficit since the early 1990s’.
‘
In 2022, the annual increase in the U.S. goods trade deficit reached an all-time high and expanded as a percentage of GDP, and the U.S. services trade surplus contracted as a percentage of GDP. These trends started to reverse more recently, with the 2023 U.S. annual trade deficit contracting by nearly 19 percent compared with 2022. U.S. trade deficit tends to be countercyclical and is largest during periods of strong GDP growth because the same drivers of increased domestic demand (including savings and investment rates) also tend to fuel increased import demand’.
U.S. Trade Deficits Are driven by aggregate saving and investment patterns
The Council of Economic Advisers’ economists explain that while the GDP accounting identity has a scoring where negative net exports—exports minus imports—are subtracted from GDP, it does not capture the full economic processes arising from the relationship between trade and growth. They argue that ‘trade deficits are also sometimes associated with import competition, which has historically generated concentrated employment losses for certain groups of workers. However, the connections between trade deficits, economic growth, and employment are closely tied to broader macroeconomic conditions. For example, when an economy is operating at full employment, a rising trade deficit can be a pressure-release valve, providing needed supplies of imported goods and services that help prevent overheating. Moreover, imports complement domestic spending on American goods and services, so that their negative accounting impact on GDP is partially offset by the domestic value added generated along with downward pressure on inflation.’
U.S. Trade Balances and Real Growth, 1992–2023
A companion article drawing on the work of the President Biden’s Council of Economic Advisors looking at the capital account that analyses the financial flows that are the counterparty to pay for the flows of trade in goods and services will follow. This analysis of the capital account was present in the Economic Report of the President published in January 2025.
Warwick Lightfoot
13 May 2025
Warwick Lightfoot is an economist and was Special Adviser to the Chancellor of the Exchequer from 1989 to 1992.