


English local government: why buoyant income tax revenue explains central control of a system in crisis, where ministerial ambition isn't matched by national funding
Explaining the functions, complex finance, opaque grant of a centrally controlled policy regime that resiles from responsibility

This article is stimulated by the recent local authority elections in England where many inexperienced local politicians have been elected for the first time. It will focus on local government finance. It is written from a perspective of admiration for the people who step forward to serve their communities, genuine empathy for the frustration that they will experience that arises from the opaque complexity that they will encounter; and I hope an affection for what they represent in a democratic society where a vibrant local democracy is important to a culture of democratic values.
I should own up to the fact that the author served as an elected member of a local authority for over thirty years. I was a member of a London borough council, the Royal Borough of Kensington and Chelsea. Most of my period as an elected councillor was spent on the Social Services Committee and as the Cabinet Member for Social Services and Health and its related committees, such as chairing the Voluntary Organisations Working Party. I was the Royal Borough’s Cabinet Member for Finance during the Conservative-Liberal Democrat Coalition Government’s austerity programme between 2010 and 2015.
I also took on my fair share of time consuming civic ceremonial duties as Deputy Mayor and Mayor. These roles are greatly appreciated by the public, yet scorned, patronised and too readily dismissed by senior local authority officers, central government departments and their officials. Few councillors, members of parliament or government ministers are popular with the public they serve.Yet traditional civic ceremonial mayors are normally popular and welcome in their communities. Indeed, this difference in sensibility between contemporary senior public administrators and the public in relation to civic tradition, offers an illustration of the cultural disconnection between many of the people living in local communities and the public sector bureaucracy that administers their services. To paraphrase the historian Owen Chadwick, a cold, bureaucratic, but not reliably capable public administration, is increasingly rubbing up against the values of the communities that increasingly doubt both their efficiency and empathy.
Much of what I understand of English local authority finance results from having been an adviser at HM Treasury between 1989 and 1992 when what amounted to, in Sir Geofrey Elton’s definition, ‘nothing less than a revolution’ in local government finance. The changes included : abolition of domestic rates; introduction of the Community Charge, introduction of uniform national business rate; the abolition of the rate capping regime on local authority taxation and expenditure; reintroduction of the capping regime, the Community Charge VAT switch that lowered the Community Charge,financed it by an increase in the rate of VAT - a 21/2 percentage point increase in the VAT rate from 15 per cent to 171/2 per cent, yielding £5.4 billion to lower the Community Charge across Great Britain by £140; and the legislation to replace of the Community Charge by the Council Tax in 1992.
I should explain that I greatly benefitted from my longstanding friendship with the late Rita Hale. As Director of Research at CIPHA, Rita took the time to explain local government finance to me, the working of the grant system, the functioning of the old business and domestic household rating system, when I was first elected as a local councillor. Rita enabled me to get a purchase on a wholly opaque set of financial relationships that were matched by their complexity. At that stage in the 1980s many local authorities were attempting to evade the operation of reductions in their grant and the capping of their rates - their capacity to raise local taxes - by engaging in complex and risky financial engineering, facilitated by American and Japanese banks along with City of London merchant banks and stockbrokers, such as Hill Samuel & Co and Phillips and Drew. At the Treasury, my education in local authority finance also greatly benefited by the serendipity of having a room on the Treasury Circle, adjacent to the late Sir Nicholas Monk, the Second Permanent Secretary, who at that time was in charge of Domestic Finance. During this revolution in local authority finance, much of his attention was taken up with its consequences.
What does English local government amount to?
Today there are 317 councils in England that the Local Government Information Unit ( LGIU) would call primary councils. They include 21 County Councils (upper-tier);164 District Councils (lower-tier); 32 London Boroughs (unitary); 36 Metropolitan Boroughs (unitary); 62 Unitary authorities (unitary); 2 Sui Generis authorities – City of London Corporation and Isles of Scilly (unitary). There are a further 13 combined authorities in England, as well as some 10,000 parish and town councils. These are politically run by about 17,000 elected members.
There are as Philip Brien’s the House of Commons Library research note Local government finance points out ‘In addition to these structures, there are 30 fire and rescue authorities in England, some of which cover more than one upper-tier authority area.2 Similarly, there are 33 directly-elected Police and Crime Commissioners in England, plus the Mayors or Deputy Mayors of London, Greater Manchester, York and North Yorkshire, South Yorkshire, and West Yorkshire (who carry out the role of PCC within their areas).
Local authority spending in England is around £125 billion a year. It accounts for a quarter of all public spending in England. Around 52 per cent of it is financed by central government transfer payments. These include redistributed business rates from the uniform national business rate, central government’s Revenue Support Grant to local authorities and the Public Health Grant. About 48 per cent of spending is financed from local sources, such as the Council Tax, locally retained revenue from business rates and local fees and charges.
What do local authorities principally do?
The National Audit Office estimates that local authorities provide their residents with 800 separate identifiable services. In terms of functions the lion’s share of the local council spending goes on schools and education services and personal social care. Adult social services and child protection and safeguarding services spend around £39.8 billion and £38 billion respectively. In round terms they account for about £80 billion of the £125 billion of councils revenue expenditure. Within the social care budget, spending on children accounts for some £15 billion to the £38 billion total. A further £4 billion is spent by local authorities on public health.
Much of the spending of local authorities and its financing is directly controlled by central government departments. Around half of the money comes directly from the central government grant and the structure and rules of the Council Tax on household property, which is framed by centrally decided rules such as the capping regime that is applied to case increases in Council Tax.
Creatures of statute: councils have duties and powers laid down by Parliament
The key thing to appreciate about English local authorities is that they are, as the Leader of Kensington and Chelsea Council, Nicholas Freeman told his newly elected members in May 1986, ‘creatures of statute’. They can only do things where Parliament has given them a power to do something or mandated a statutory duty for councils to carry out. At the heart of this statutory framework are the powers or Vires that councils have. If these Vires are exceeded, authorities can be challenged in court. There is an extensive case law going back to before the 1880s establishing these powers and a breach of them is not a remote or recondite matter. The breach of the local authority Vires was at the heart of the Hammersmith and Fulham case in 1991 where the Judicial Committee of the House of Lords declared all the complex financial transactions involving derivatives, void because the council did not have the power to make them.The result was that American and Japanese banks lost millions of pounds and ran a campaign for the Treasury to bail them out, which the Bank of England fronted in representations to the Treasury. It failed because it would have driven a coach and horses through the legal framework that protects local and national taxpayers from irresponsible mismanagement of local councils.
Local authorities are given many duties that they have to carry out, such as providing primary and secondary schools, assessing and providing for the need for social care, such as a home help or a place in a residential or nursing home, and protecting and looking after vulnerable children by managing child protection registers, assessing families with children and where necessary taking children into care either in children' s homes, with foster families or in secure units. They also have powers, such as a general well being power where they have discretion over what they do. Since 2000 both the centralisation of school funding and the process of academisation have contributed to the atrophying of the traditional local education authority and is an example of the nationalisation of local authority service.
Local authorities have limited tax raising powers over a tax base that is not buoyant
English local authorities have limited tax raising powers and a narrow tax base to raise the money to carry these complex and expensive duties out. Neither the Council Tax or the business rates, nor the old domestic rates, are what economists would call ‘buoyant’ sources of revenue. These do not rise as national income evolves in the manner of income tax or broad expenditure taxes such as VAT and its predecessor purchase tax. In practice this means local councils have statutory duties that increase without rising matching revenue to fund these obligations.
England is a highly centralised state that reflects that 19th central government had buoyant revenue from income tax to pay for modern services that parishes, boroughs and counties did not possess
There is nothing new in this. Understanding the distinct fiscal and institutional history of the English state is central to understanding the present structure of local government and its challenges. At the end of the 18th century Willaim Pitt introduced an income tax to finance the war with France as a temporary measure. It was abolished in 1816, but reintroduced to finance the loss of revenue arising from the abolition of the Corn Laws in the 1842. The result was that in the second half of the 19th century the central government’s exchequer had a rising and buoyant source of revenue.
Treville Street Board School Plymouth - Now we must educate our masters - Foster’s Education Act

This coincided with the need for modern states to develop systems of mass elementary education and to provide services, such as secondary education and housing. When this started in the 1870s local government amounted to little more than the parishes with obligations to relieve poverty under legislation that flowed from the Poor Law Relief Act of 1601 in the reign of Elizabeth I, financed by the old rating system. This could not remotely yield the tax revenue needed for a modern service such as elementary education. When William Gladstone’s administration passed Forster's Education Act in 1872, making elementary education compulsory and setting up School Boards with a statutory duty to provide it, the finance was provided by a Treasury grant. This became a pattern as local authorities were given the power to provide a service or a duty. For example in 1902 boroughs were given the power to provide secondary education under the Balfour Morant Act, but it was not until the Butler 1944 Education Act that it became a duty. The Artisans’ and Labourers’ Dwellings and Improvement Act passed by Benjamin Disraeli in 1875 gave boroughs the power to clear slums and provide sanitary housing. In the first half of the 20th century county councils and borough councils were steadily given powers and duties to provide most of the sort of services associated with modern local government.
Corporation Buildings Looe Street built on the site of a notorious slum on Plymouth’s historic Barbican

The money came from an increasing range and quantity of central government grants financed by the Treasury. This was because the Treasury had a buoyant source of revenue from income tax and was in a position to finance this expansion of public services expected of local government by statute. Where Treasury grants were made so went Treasury control. If the central government gave a local borough money to provide a service, it wanted to ensure the service was carried out to its satisfaction.The first major central inspectorate was Her Majesty’s Inspectors of Schools set up to ensure that grants for education were properly applied. The poet and literary critic Mathew Arnold was one of its inspectors.
As English local government developed with county councils, boroughs and theLondon County Council carried out more and more complicated public services directed as duties from the centre, the system of grants expanded. The Treasury neither trusted local authorities to spend its grant prudently and nor did the Treasury trust councils sufficiently to provide them with buoyant powerful local fiscal powers over sales, income and capital taxes. The result was the development of a modern public sector that is unusually centralised in terms of the sort of services that are provided, how they are provided, who is entitled to them and how they are financed.
The Modern Grant System
In 1958 Dame Evelyn Sharp, the Permanent Secretary at the Ministry of Housing and Local Government persuaded Harold Macmillan’s Conservative Government that it would be more efficient to combine all the different grants that local authorities were given into a single transfer payment. This was intended to give local councils greater flexibility in carrying out their functions in relation to their perceived local circumstances. This apparent expression of confidence in local decision making should not, however, be mistaken for Whitehall simply letting go and freeing local government from interference. Richard Crossman her Labour Minister in the 1960s had an acrimonious relationship with the famously formidable Dame,writing in the Dairies of a Cabinet Minister that she was ‘wanting improvement and social justice quite passionately and yet a tremendous patrician, regarding local authorities as children which she has to examine and rebuke for their failures’.
In any event Dame Evelyn’s persuasive intervention led to the creation of a standard grant regime where money was distributed to authorities on the basis of the need to achieve a roughly equivalent standard of service across the country taking account of differences in social need and economic resources and revenue from property taxes in different communities. Its calculation was anything, but simple. It had many merits but its calculation and distribution added to the opacity of an already complex financial structure. The purpose of this complexion was to facilitate comparable standards of public service delivered through local authorities across the country from Cornwall to Merseyside, whether they were delivered by a county, metropolitan borough or a London borough. From the late 1950s until the 2000s a single block grant with very little hypothecation was the way the grant was distributed. The first major breach of this arrangement was the ring fenced grant to pay for the transfer of funding effected through the Community Care Grant following the Griffiths Report in the 1990s.
After 1997 Labour ministers made increasing use of specific ring fenced grants to achieve particular central departmental policies that they did not trust councils to carry out to their satisfaction. This created inflexibility and less efficient spending and was largely reversed by the Conservative Liberal Democrat Coalition in 2010. However after 2013 hypothecation crept back in with councils being invited to bid for specific pots of money. At the same time the criteria for distributing the main grant was effectively frozen and not updated for changes in need and circumstances. There was greater pressure for local authorities to augment their own spending power through incentives given to them, such as the retained business rate schemes. If anything these changes made an opaque system less clear, more arbitrary and less efficient.
The Gentleman in Whitehall knows best?
Almost all the principal changes in service provision made by local authorities over the last sixty years have come from central direction in Whitehall. This includes new duties and new and detailed guidance on the manner in which services are provided. These big changes include: the abolition of selection at 11 in state secondary schools, the abolition of most grammar schools and the comprehensive school revolution, associated with Anthony Crosland and Mrs Shirely Williams; the creation of modern Social Service departments on the model proposed by the Lord Seebohm’s report in 1968, carried out by the Secretary of State for Health and Social Services; the policy of mental health hospital discharges to the community that started with the Minister of Health Enoch Powell’s ‘water tower speech in 1961 that looked forward to a 50 per cent reduction mental health patients staying in long stay hospitals or asylums, given much greater impetus by the Conservative Government in the 1980s responding to the Audit Commission's report Making a Reality of Community Care, the policy of Care in the Community and the closure of long-term mental health hospitals implemented in the 1980s; the 1989 Childrens’ Act the basis of contemporary child protection services; and the National Health Service and Community Care Act 1990 that placed the mental health community care policy on a statutory basis and implemented Sir Roy Griffiths Report on community care funding for elderly people, ending what he identified as the perverse incentive to place frail elderly people into residential care that they neither realistically needed or would choose, because by placing them in a private or voluntary home the cost could be charged to the national social security budget, whereas the provision of proper and more appropriate domiciliary care, such as home helps would be financed by a council’s own social services budget.
National cost saving agendas - rationing - through policy guidance and inspection distort public service delivery
The big changes in policy are driven by nationally determined policy imperatives and an inspection regime that ensures that a detailed policy guidance regime is carried out. At the heart of much of the policy guidance and the implementation of it is a central government agenda to contain the costs of expensive demand led educational and social service costs. The 1990 Community Care Act addressed a perverse incentive, but capped the cost of social care through transfer of funds from the Social Security budget to local authorities social services departments. Its policy guidance over the last thirty years has raised the threshold where services are provided to a level where only very frail people are provided with a social care service. The Royal Borough of Kensington and Chelsea, for example in 2016 was almost alone in still providing home helps for people with moderate care needs.
As statutory duties have become more onerous and their policy guidance has become more complex, the evolution of local authority finance has matched their complexity and detailed intrusion and direction. Local authorities have strict financial, accounting and audit rules applied to them. Councils have to set a balanced budget each year where spending is matched from revenue from government grants, council tax, retained business rates and charges and the drawing down of cash reserves. There are strict controls on the way that councils can use receipts from sales of assets such as council houses and local authority owned buildings.
Relatively cheap borrowing from the Public Works Loan Board - be careful what you wish for
And there are controls on the amount that councils are allowed to borrow through the Public Works Loan Board. The PWLB was set up in the mid-1970s to enable councils to borrow at the cheap rates that the Treasury could borrow at through the Gilt Market in UK government bonds. This was attractive to councils but came with a catch. Their access to this cheaper source of debt was determined by ‘permissions’ to borrow.
The long famine in local authority capital accumulation through borrowing
Government borrowing for the PWLB was scored against the consolidated public sector balance sheet used to construct the Public Sector Borrowing Requirement. From December 1976 this was subject to IMF conditionality and after the 1980 Budget to the rigours of the Medium Term Financial Strategy. Whereas English local authorities used to borrow issuing bonds bought by retail investors, such as my late grandmother, these bonds had virtually disappeared by the end of the 1970s. Through control over permissions to borrow from the PWLB and tight rules on the use of capital receipts, in a context where the Treasury wanted to retrain overall public sector borrowing for more than twenty years local authority capital spending was constrained.
These restrictions were eased after the Millennium. The 2000 the local authority finance Green Paper led to a more permissive borrowing framework, based on a prudential code. The UK Debt Management Office note on the history of the PWLB lending facility History of Public Works Loans probably provides the most concise summary of an ambiguous and opaque change ‘In 2000 the government issued a Green Paper, which suggested replacing the then existing credit approval system for controlling capital expenditure with a prudential regime to determine affordability. This Green Paper was followed by a White Paper in 2001, which proposed a new prudential capital finance system. The framework for this proposal was introduced in the Local Government Act 2003. The framework provided by the Local Government Act 2003 was supplemented and developed through the Prudential Code, which was published by the Chartered Institute of Public Finance and Accountancy (CIPFA). This formed the governance framework for the PWLB lending from 2004’.
A famine in council debt finance is followed by a feast the decade of debt
Councils eventually issued bonds in their own name, increasingly borrowed from each other and in some cases aggressively borrowed from the PWLB when the Treasury permitted it. After about fifteen years of much greater permissiveness in relation to debt and borrowing following irresponsible borrowing by councils there has been a return to much tighter control over debt. Some local authorities used aggressive commercial investment strategies financed through debt to generate income to avoid making cuts to their services as central government grants and support was reduced between 2010 and 2015. This has resulted in an increase in overall local authority debt in relation to assets and in several instances egregious local financial failure, resulting in councils having to be placed in special measures where their finances, spending and provision of services is centrally directed by the Ministry of Housing, Local Communities and Local Government.
The NIESR in a research note published in June 2024 Local Authority Finance a decade of debt set out this accumulation of debt vividly. ‘Local authority debt has nearly doubled since 2010: there has been a substantial increase in the use of loans since 2010 as many local authorities invested in capital to meet future financial shortfalls by taking advantage of comparatively low rates available over this period’. Using 2023 ONS data the paper shows that ‘local government loans stand at over £100 billion, 78 per cent higher than it was in 2010’.
The NIESR paper locates the rises in local authority debt to the "introduction of the 2003 Local Government Act and the accompanying 2003 Capital Accounting regulations (commonly referred to as ‘the code’). This gave local authorities a framework whereby they could borrow to invest in capital projects, which typically have been commercial and residential property developments. The prudential regime has given local authorities responsibility for their own financial decisions; however, it stipulates that borrowing should not only be for financial return. Prudential borrowing steadily grew as a percentage of local government borrowing, from 15 per cent in 2005 to 43 per cent by 2020-21’.
New local government credit instruments and agencies were created in response to this more permissive regime. They included the introduction of the 2003 Local Government Act and the accompanying 2003 Capital Accounting regulations (commonly referred to as ‘the code’). This gave local authorities a framework whereby they could borrow to invest in capital projects, which typically have been commercial and residential property developments. The prudential regime has given local authorities responsibility for their own financial decisions; however, it stipulates that borrowing should not only be for financial return. Prudential borrowing steadily grew as a percentage of local government borrowing, from 15 per cent in 2005 to 43 per cent by 2020-21 UK Municipal Bond Agency created in 2014 enabled councils with strong credit ratings to borrow on better or lower rates of interest than the conventional PWLB debt would offer. Among the innovations was a version of crowd financing for projects.Community Municipal Bonds (CMB) crowd sources funds from residents who contribute modest amounts and receive regular returns from projects that are often financing green investments.
The result has been a large increase in local authority spending on debt service charges. This has resulted from a higher stock of debt and an increase in interest rates raising the cost of serving debt when it is rolled over. After the Great Recession in 2010 interest rates were very low. Average interest on a 10-year loan was roughly 2.5 per cent between 2010 and 2022. Since 2022 interest rates have risen sharply. Ten year money now costs a local authority around 5 per cent. Local government therefore spends an increased ratio of its budget on servicing debt. Debt interest costs now account for about 15 per cent of the overall local authority budget compared to something closer to 9 per cent in 2015.
Several local authorities tried to use borrowing to build up commercial investment income that could be used to offset their fall in grant, and did so in a reckless manner. This was the approach taken by the London Borough of Croydon. Its auditors Grant Thornton reported in 2020 the council attempted to ‘invest its way out of financial challenge rather than pay attention to controlling expenditure on core services’. Croydon went on to issue a section 114 notice. In 2020 National Audit Office drew attention to the fact that 49 out of 352 local authorities were responsible for 80 per cent of all commercial spending in local government. The NIESR concluded from this that such imprudent strategies were likely to be localised exercises in profligacy, but Croydon is in good company.
Local Authority Accounting, Audit and Financial Control Rules - an historically tight accounting regime
The accounting and audit regime is strict with accounting conventions analogous to those in the commercial private sector. Some of them are arguably stricter, such as the convention for valuing a capital asset in its present use rather than at its open market use. This is conservative in terms of assessing the credit of an authority while in terms of identifying the full resources it is deploying economically to provide a service it under states the opportunity cost involved for the economy as a whole. Traditionally the audit was carried out by the District Audit Service. When Michael Hesletine as Mrs Thatcher’s first Secretary of State for the Environment, set up a national Audit Commission in 1982 to improve analysis and measurement of performance councils, he also allowed on a rotating basis to switch to using private commercial auditors, for periods before the audit returned to the District Auditor. Michael Heseltine thought that commercial auditors would bring a commercial flair to identify opportunities for value for money and resource management. Local government has stricter accounting rules that yield more information about spending and unit costs than central government departments.
The key to local authority financial control : the balanced revenue budget rule
By being obliged to set a balanced budget without borrowing, local authorities operate within a hard budget constraint in a manner that central government departments, such as the Department of Health and its regional trusts do not. The difference in accounting and cost information between central government departments and local authorities are exposed when functions are transferred from central government to local government. Good examples are provided by the Metropolitan Police and Public Health. When the Metropolitan Police were transferred to the Greater London Assembly the paucity of accounting and unit cost information compared with what would normally be expected was swiftly exposed. When responsibility for Public Health was returned to local government responsibility in 2010, it took the Department of Health officials some nine months to identify the part of the department’s budget spent on it. When the transfer actually took place local authority finance officers were surprised at the looseness of the procurement and contracting they inherited.
The suggestion that local government is on the edge of bankruptcy is highly misleading. There are strict rules on annually balanced budgets, rigorous audit and controls on the use of receipts from assets that have been elaborately worked up to control local authorities. As the House of Commons Library has explained ‘Local authorities must set a balanced budget for each financial year. They must also maintain a system of internal audit, and make arrangements for the external audit of their finances and the value for money achieved in their provision of services’
Section 114 Notices are a mechanism of prudential enforcement not bankruptcy
If an authority is likely to be unable to meet the balanced revenue budget rule under the Local Government Finance Act 1988 the director of finance is obliged by law to issue a Section 114 notice. This requires an authority to meet and agree measures to remedy the unbalanced budget and enables the authority to apply for permission to receive ‘exceptional financial support,’such as being allowed to draw on capital assets to finance revenue expenditure. There is no process in law for an English local authority to go bankrupt. The Section 114 notice regime is part of the control framework that prevents authorities from becoming insolvent.
Before 2010 Section 114 notices were unusual. In October 2000 a section 114 notice resulting from a failure to balance the budget was issued in London Borough of Hackney. The House of Commons Library has noted that ‘since 2020, a system of ‘exceptional financial support’ has been developed, allowing authorities to access capital funding to shore up gaps in day-to-day spending. Since 2018 some ten authorities have issued them. The Section 114 regime is a system for the enforcement of local authority prudential financial control and audit not a route to insolvency. To describe it as ‘bankruptcy' is wholly misleading.
Local authority pension schemes are overall in an actuarial surplus
Likewise any suggestion that local authority pension schemes are ‘Ponzi schemes’ is highly misleading. Local government has a defined benefit scheme based on a career average. It is a funded scheme, unlike the pay as you go pension schemes in the rest of the public sector.
Each local authority’s employers and employees make contributions to accumulate funds to spread the future cost of it.based on salary and length of service. Unlike the other main public service pension schemes which operate on a pay-as-you-go basis, investments are accumulated to pay the pensions. Every three years the individual council schemes are assessed in a Triennial Actuarial Review that assess contributions, assets and liabilities. Most local authority pension funds presently enjoy an actuarial surplus and there may be scope in future years to lower the contribution rates that actuaries assess as necessary to keep the schemes solvent. Local government is unusual in the British public sector in having a properly and fully funded pension scheme for its employees. The Government Actuary’s report on the Local Government Pension Scheme England and Wales in 2024 indicated an overall surplus of assets to liabilities in the 87 pension funds it monitors - total assets had grown from £290bn in 2019 to £366 billion in 2022. While total liabilities were estimated to be £344 billion in 2022. This improvement was largely the result of improvement arising from investment returns.
There is a sensible discussion to be had about local authority pay and the relative generosity of the defined benefits pension, but it does not turn on a narrow scoring of financial viability, but broader issues that turn on political choices relating to management of recruitment, motivation and retention, equity with the private sector,taxable capacity and the opportunity cost of public services.
Why has the national government decided to retain so much control over local authorities, continues to deliver such important services through them when ministers and officials despise the capacity of councils to perform and behave responsibly?
Part of it is an accident of institutional history and part of it is a desire for ministers and civil servants to be at several removes from the delivery of policies and services that are important in the everyday lives of people yet difficult to provide. The safeguarding and protection of children in their homes is exceptionally challenging. Organising a rota of homehelps and deciding what they should do to help frail elderly people - to the satisfaction of the users of the domiciliary home service as opposed to its organizers of it - is equally difficult to get right. While Aneurin Bevan may have celebrated the direct political accountability to the Minister in Whitehall, saying ‘If a bedpan is dropped in a hospital corridor in Tredegar, the reverberations should echo around Whitehall, most ministers and senior civil servants prefer to be out of the way. Rather than direct responsibility the preference is more that of cultivated irresponsibility removed removing central government policy makers from effective accountability for what happens in practice. Public services decided through legislation, policy guidance and finance at the centre, yet delivered through local councils is useful when something goes wrong. It protects central government departments from criticism. For example, while much of education policy and the management of schools has been nationalised local authorities still retain responsibility for managing difficult matters such as disability, educational psychology and pupil referral units. One Treasury official expressed it vividly.The opacity of the relationship was useful, particularly when there had to be discretionary reductions in spending. When the complexity of what is happening can be obscured. Musing, for example, that the worst thing would be a cash voucher for a service, such as education, where the public would see its cash value, making it much more difficult to cut without the public noticing.
Conservative Liberal-Democrat Coalition’s Programme of Austerity following the Great Financial Crisis and its legacy
It is not an accident that local authorities bore the lion’s share of the downward adjustment in spending after the Great Financial Crisis between 2010 and and 2015. This squeeze in local authority spending came after a period when central government departments, such as health had been protected. Local services such as policing, social care and parts of the criminal justice system that relate to the work of local councils had been treated as relative Cinderellas compared to health and social security benefits badged as tax credits between 2000 and 2010.
The House of Commons Public Accounts Committee’s report Financial sustainability of local authorities, in 2018 explained the direction of travel arising from cumulative discretion policy decisions. central government funding for local authorities fell by 49.1 percent in real terms between 2010 and 2018. This was equivalent to a real term reduction in spending power of 28.6 per cent. The term “spending power” measures the resources made available for local government funding to local authorities through government funding and council tax. The concept of ‘spending power’ was developed to capture local authority capacity to spend using not just central government grants but including changes in the taxing capacity of councils through increases in the council tax. This superficially suggested less resource pressure on councils than merely looking at central government grants and other transfers fell. Yet the power to raise the Council Tax was also constrained through caps on Council Tax increases and the use of referendums.
Regional Change in Local Authority Core Funding 2010 to 2020
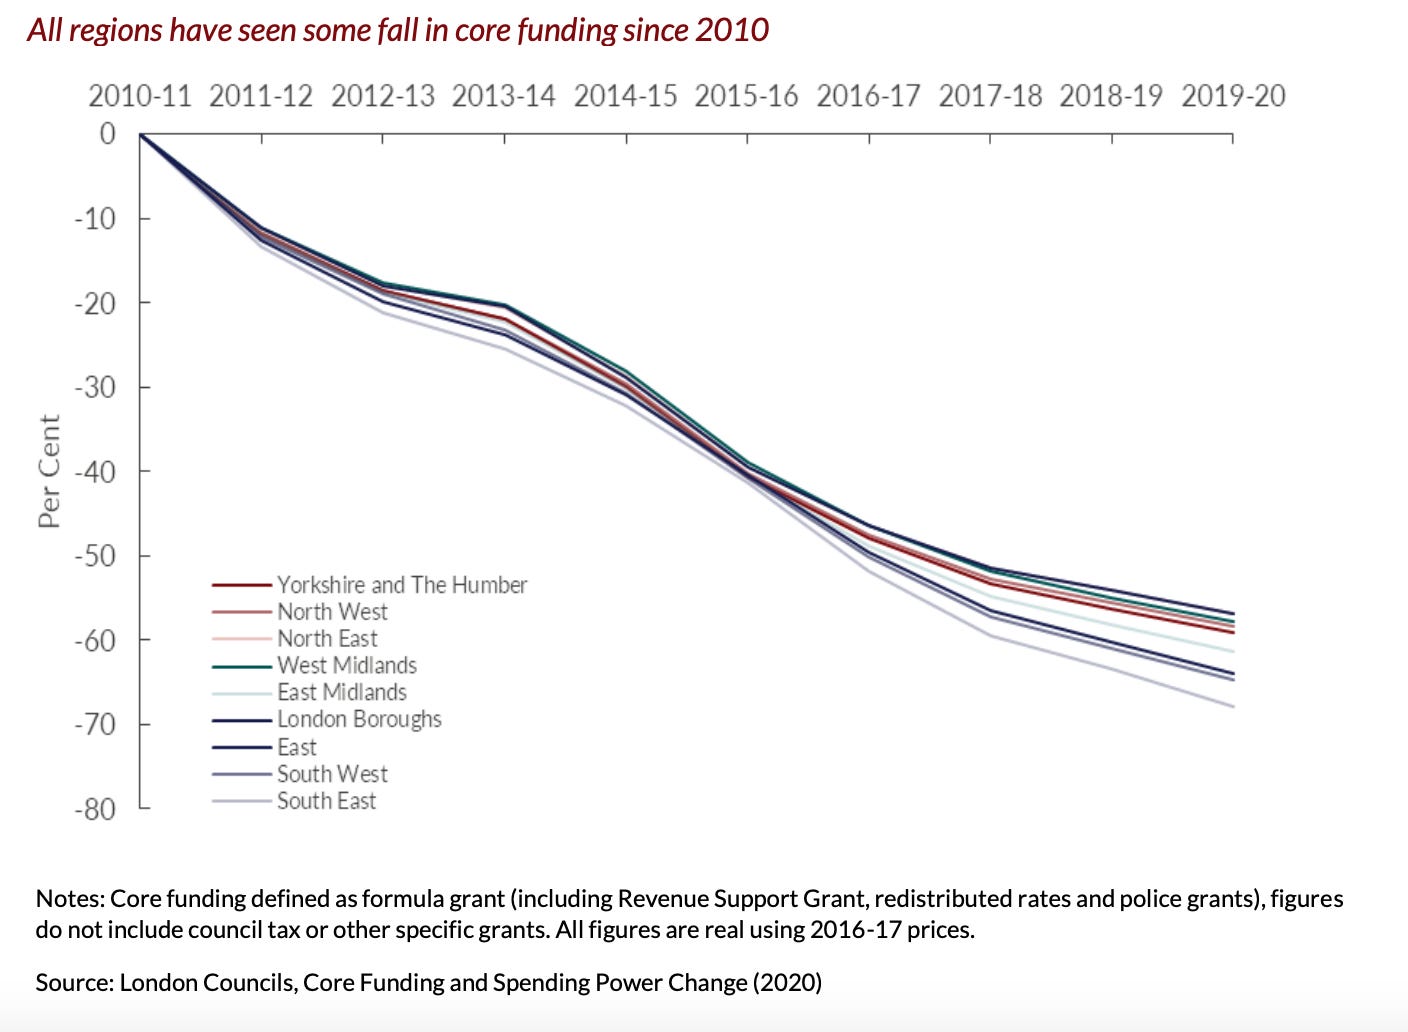
Source NIESR
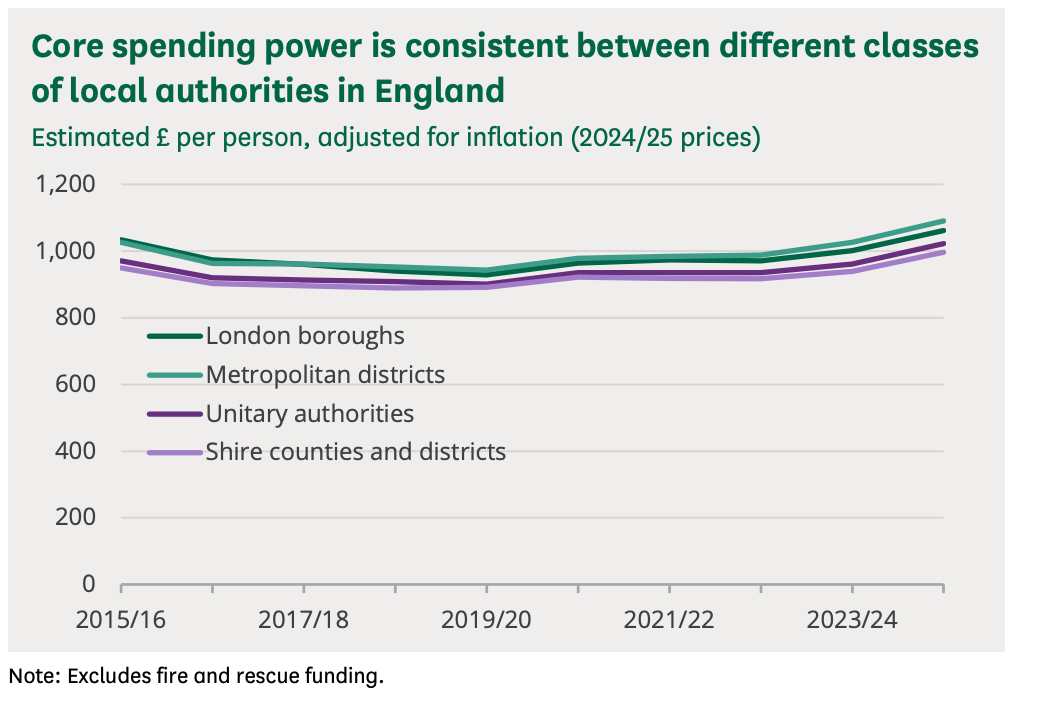
The squeeze on local authority spending was maintained after 2015 until the early 2020s As Philp Brien’s House of Commons research note published in May 2024 Local Government Finances note shows that spending power fell in real terms for all classes of authority between 2015-16 and 201920, before starting to increase again’. He also shows that ‘there is very little variation in spending power per person between different types of authority. This is because those authorities which can raise more of their own revenue typically receive less settlement funding, meaning that the overall amount of money available is evened out. For example, in 2024- 25, 66 per cent of the core spending power of shire counties and districts came from their council tax requirement, with 19 per cent from settlement funding; for metropolitan districts, 47 per cent came from the council tax requirement and 37 per cent from settlement funding.’
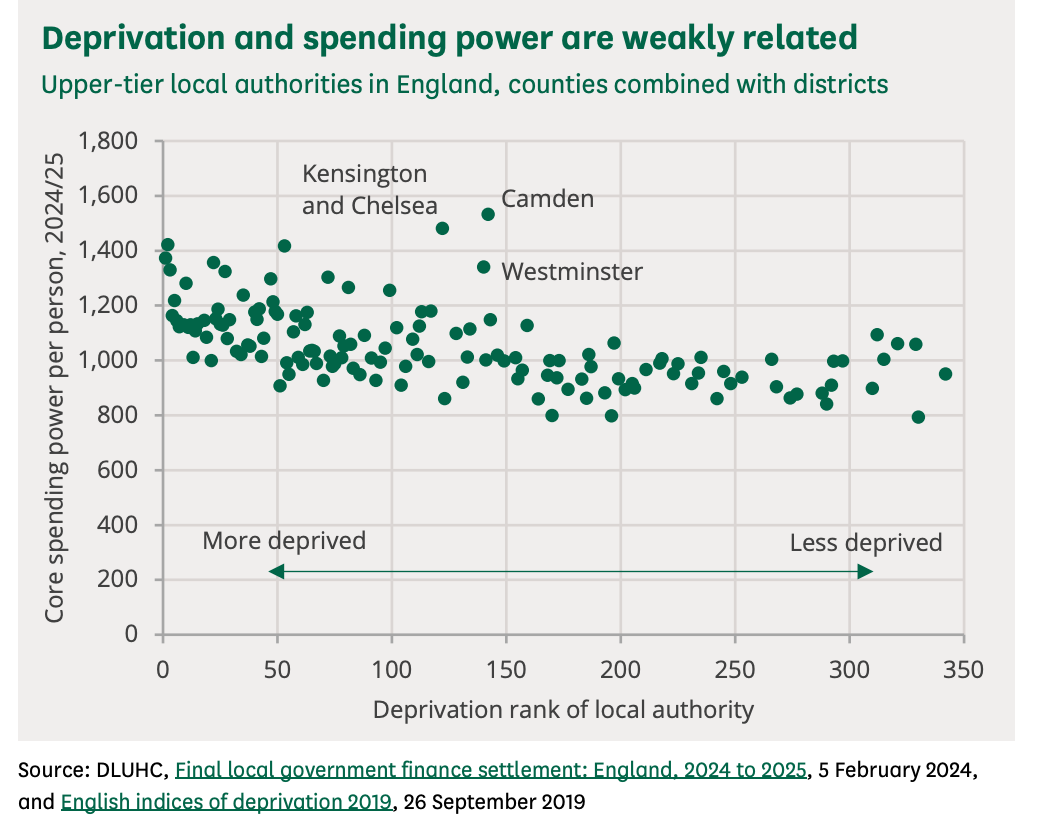
Philip Brien’s research note also shows that the relationship between core spending and need in terms of deprivation is weak. “local authorities with low deprivation tend to have lower spending power than those with high deprivation – there is considerable variation in spending power between authorities with similar levels of deprivation. For example, Camden’s spending power is higher than that of some other London boroughs with similar levels of deprivation’. This reflects the movement away from a system of central grants distributed by need. Where spending power would turn more on permission to use local taxing power than is not correlated with social need.
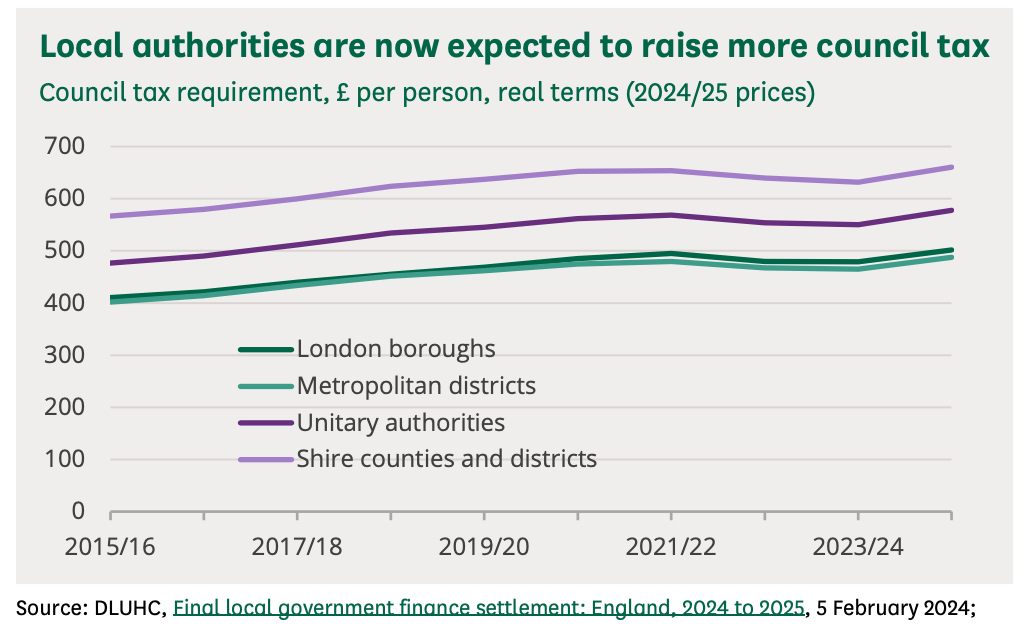
The research note also exemplified how the Conservative Government in 2024 expected increasing core spending power to come from increased receipts from Council Tax.
The new Labour Government’s local financial settlement for 2025
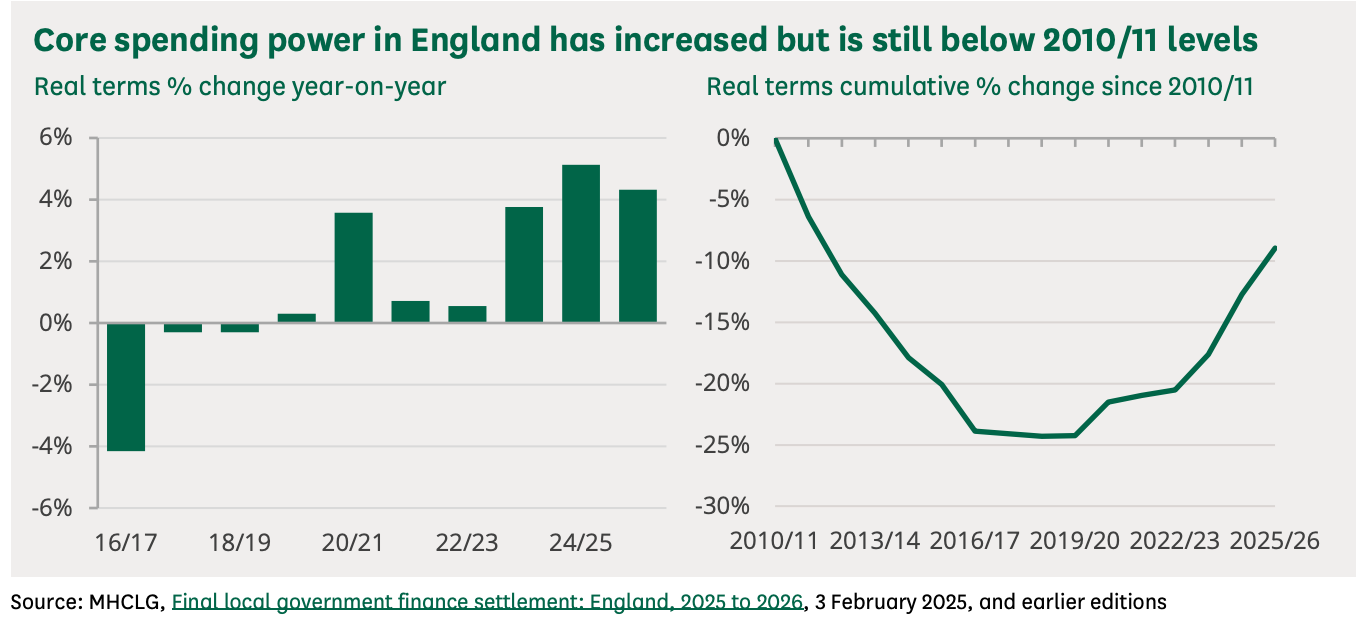
The House of Commons Library research note Local Government Finance Settlement 2025-26 recognises an overall increase in core spending power in the new Government’s settlement but points out that it is broadly in line with increases in core spending made by the previous Government in recent years, ‘However, in real terms, core spending power is still around 9 per cent below where it was in 2010-11.
The central problem in modern local authority finance is a mismatch between national policy aspirations for adult and children's social services that ministers instruct local councils to carry out the money ministers give them to spend on them.The National Audit Office’s report on Local government financial sustainability published in February 2025 that updated its previous work sets out the position well. Local authority spending one way and another has been squeezed for about fifteen years. At the same time the population of England has risen, demand for services provided by local authorities has risen as a result of an aging population and changes in clinical psychological practice that has expanded the diagnosis of children identified having special educational needs. These three factors have increased demand for so-called demand led services.
These particular services have moreover been subject to specific cost pressures arising from general inflation and specific market pressures in the specialist care sectors. As the NAO report notes ‘in children’s social care, where most placements are with private providers, the average cost per child looked after has risen in real terms by 35 per cent from £72,345 a year in 2015-16 to £97,326 in 2023-24. And between 2015-16 and 2023-24, the average weekly fee for adult social care home places for those aged 65 and over has increased by 33 per cent.’ The increase in children with special educational needs has been accompanied with an increase in taxi costs for local authorities. These have risen 106 percent from £0.86 billion in 2015-16 to £1.76 billion in 2023-24 in real terms. There is a growing cohort effect where increasing numbers of disabled adults need expensive social care as they leave childhood compared to those over 65 years of age. People needing care aged between 18 and 65 of working age tend to have more complex and expensive care needs than people over 65. The NAO report notes that ‘in 2023-24 the average cost of long-term support for working-age adults was £1,696 per week compared with £951 for those aged 65 and over.’
The central problem in English local authority provided services is a mismatch between the statutory duties and policy guidance placed on local councils and the demand for the services mandated by those duties decided by central government and the central government grant and tax raising powers that central government chose to provide councils with. During a period when local authorities were subject to a protected discretionary squeeze in spending education, health and care plans were introduced. The Children and Families Act 2014 provided a plan for the child that went beyond education to include health and social care up to the age 25. The NAO reports that between January 2015 and January 2024 there was a 140 per cent increase -240,000 to 576,00 in the number of 0- to 25-year-olds with education, health and care (EHC) plans. Modified policy guidance has standardised access to adult social care assessments. New requests for publicly funded adult social care support have risen by 15 per cent. While the demand for placements for children looked after by social services rose 19 per cent where there was no change in the statutory duty or policy guidance.
This mismatch between centrally determined spending duties and centrally provided resources has led to authorities issuing Section 114 notices. A framework of Exceptional Financial Support was introduced in 2020-21. It provides financial assistance by allowing capital to be used to finance current spending. Forty two councils have received £5 billion of financial support from the government to help them manage these financial pressures. As the NAO explains it ‘relaxes the normal finance rules and allows the local authority to borrow money or sell assets to balance its day-to-day spending budget’. But as the NAO rightly points out, it ‘does not address the underlying cause of overspending and creates longer-term risks for local authorities’. The scale of the challenges that councils have is reflected in the list of authorities that were given permission to raise their council taxes by more than the normal 3 per cent for general spending and and 5 per cent for social care cent .

Source House of Commons Library
Local authorities and their national representative organisations, such as the Local Government Association and CIPHA and many think tanks such the IFS and the Institute for Government will explain the case for a much more generous national grant regime distributed on the basis of need financed by taxation. If they become ambitious and adventurous they reexamine the case for fiscal devolution giving local authorities to tax local incomes, company profits and sales. In effect reopening the issues that the Layfield Inquiry reported on in 1976. The difficulty with centrally provided money is that local councilors and council officers are not properly accountable for it because they do not have the political opprobrium of raising it. As Douglas Ashford noted in A Victorian Drama: The Fiscal Subordination of British Local Government writing in 1980 ‘the subordination of the local government system through the tax structure has been virtually unchanged since the ‘19th century. ‘Throughout the 20th century the Debate revolves around the grants system, its revision, distribution and amount’. The difficulty of full fiscal devolution in England is that taxable capacity does not neatly correlate with social need and deprivation. Much economic activity is highly concentrated, as a result of the process of de-industrialisation that was well under way when Sir Frank Layfield reported in 1976. And it is concentrated to an even greater extent today.
Is it time to curb unrealistic aspirations and to interrogate expensive unit costs that have been ignored for too long?
Given the over expansion of the state, the disappointing results of national and local public intervention at the margin, the range of social pathology that policy has achieved such little traction over in more than seventy years of energetic policy, in the context of a public sector which at 45 per cent of GDP crowds out and constrains private activity and tax burden at a historically high ratio of national income, perhaps it is time for more radical thinking. Perhaps there should be a radical review of the duties and policy guidance given to local government. Its purpose would be a more realistic alignment of what can be achieved and the resources and can or should be applied to carrying out those duties. Along with such an assessment of what policy aspirations should be set aside should also be an interrogation of the complex cost base of services such as the costs of looked after children, secure accommodation and the temporary accommodation for asylum seekers and homeless people in temporary accommodation.
It is over forty years since the Conservative Chairman of Birmingham City Council’s Social Services complained about the high cost of children's placements. Her strictures made a great impression on the Dartington Social Research Unit that specialises in research and practice in relation to the social care of children. Some twenty years later its director of research still remembered Mrs Edwina Currie’s strictures on the failure to interrogate and control those costs. A quarter of a century again, they still need to be investigated. Maybe this is the moment to pick up where Mrs Currie left off?
Warwick Lightfoot
15 July 2025
Warwick Lightfoot is an economist and was Special Adviser to the Chancellor of the Exchequer between 1989 and 1992